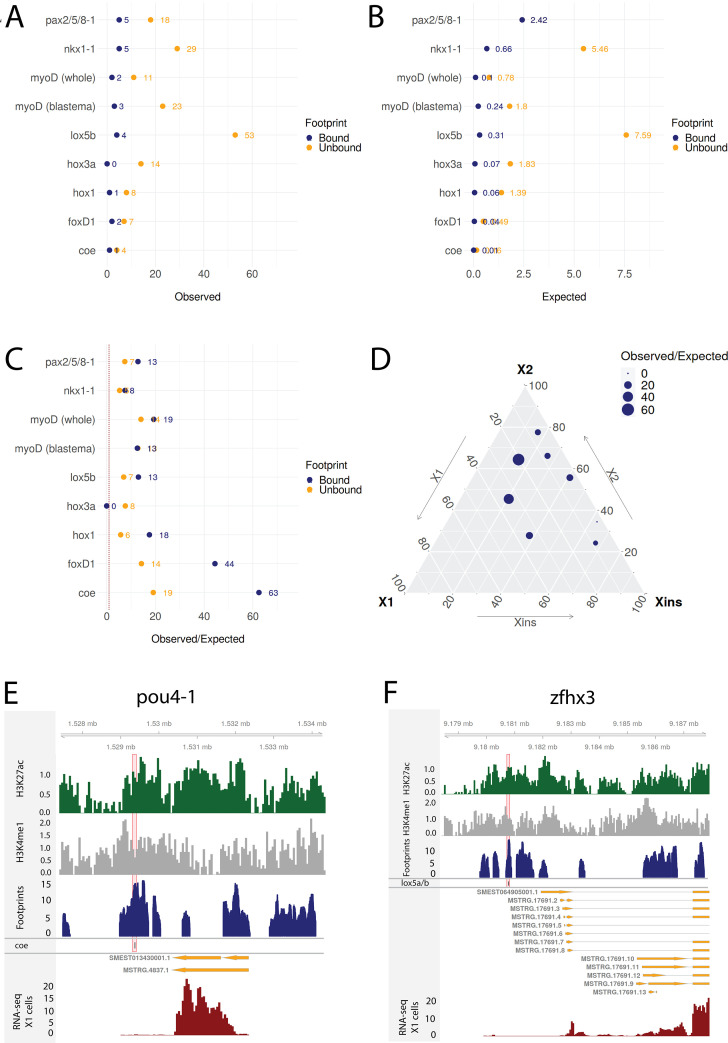
Figure 8. Transcriptomic data from knockdown experiments supports predicted regulatory links.
(A) The number of observed regulatory links between the knocked down transcription factor (TF) (y-axis) and differentially expressed TFs in our gene regulatory network (GRN) model. The regulatory links with unbound and bound footprints are displayed separately. (B) The number of expected regulatory links between the knocked down TF (y-axis) and differentially expressed TFs. (C) The ratio of observed and expected regulatory links as obtained from transcriptomic data for knocked down TFs. The regulatory links with unbound and bound footprints are displayed separately. (D) A ternary plot displaying the observed/expected ratio alongside the proportional expression values of the X1, X2, and Xins compartments. The size of the dot corresponds to the observed/expected ratio. The ratio is higher closer to the X1 and X2 compartment maxima, indicating that the GRN model predicts links better for TFs with higher expression in stem cells. (E) Genomic track of pou4-1. One coe bound footprint within a downstream enhancer-like region (width 100 bp) is marked in red. (F) Genomic track of zfhx3. One lox5a/b bound footprint within an upstream enhancer-like region (width 100 bp) is marked in red.


