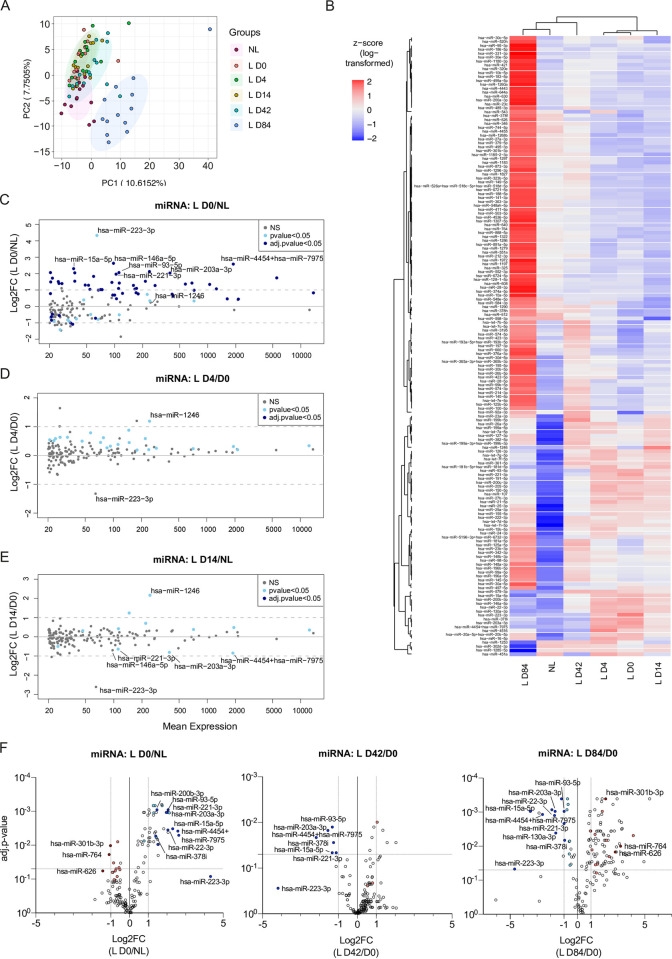
Fig 3. Changes in miRNA expression profile in psoriatic skin during secukinumab treatment.
(A) Principal component analysis based on miRNA expression levels in individual patients from non-lesional and paired lesional psoriasis skin before (L D0) and after 4 (L D4), 14 (L D14), 42 (L D42), and 84 (L D84) days of treatment. (B) Heatmap with unsupervised hierarchical clustering of mean miRNA expression (as z-score of log-transformed values) between patients from non-lesional and paired lesional psoriasis skin dependent on the day of treatment. (C-E) MA plots depicting changes in miRNA levels between lesional and non-lesional skin (C), lesional skin before treatment (L D0), and lesional skin during secukinumab treatment on day 4 (D) or 14 (E). Depicted are the log2FC relative to mean expression. Multiple paired t-test with correction for multiple comparisons (FDR-Benjamini-Hochberg). (F) Volcano plots depicting changes in miRNA levels between lesional and non-lesional skin (left), lesional skin before treatment (L D0) and lesional skin during secukinumab treatment on day 4 (middle) or 14 (right). All colored dots depict miRNAs that were deregulated in lesional skin before treatment and were reversed in their expression pattern after 42 and/or 84 days of treatment (|log2FC|>0.5 and p-value<0.05). Blue dots (dark and light blue) depict miRNAs with higher expression in lesional skin before treatment. Red dots (dark and light red) depict miRNAs with lower expression in lesional skin before treatment. Darker and lighter colors indicate miRNAs with |log2FC|>1 and |log2FC|>0.5 (in both D0 and D84), respectively; n(NL, L D4, L D14, and L D43) = 14, n(L D0 and L D84) = 13. Depicted are only miRNAs with an average expression above 20 counts (n = 162).

