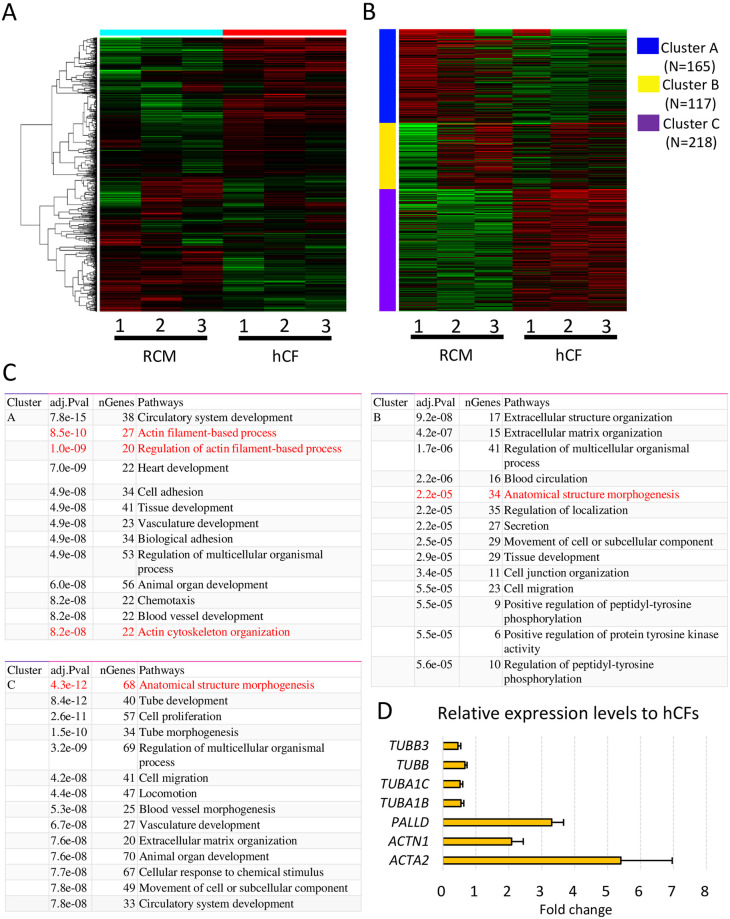
Fig 3. RNA-sequencing analyses of cardiac fibroblasts (CFs).
(A) Hierarchical clustering of top 1000 genes between restrictive cardiomyopathy (RCM) and healthy control CFs (hCF). (B) K-means clustering of RCM CFs and hCFs. (C) Pathway analyses of K-means clustering indicate that actin filament-associated processes and anatomical structure morphogenesis are affected in RCM CFs. (D) Differential gene expression analysis revealed that expression levels of several genes associated with the cytoskeleton and cell adhesion are significantly up- or down-regulated in RCM CFs.

