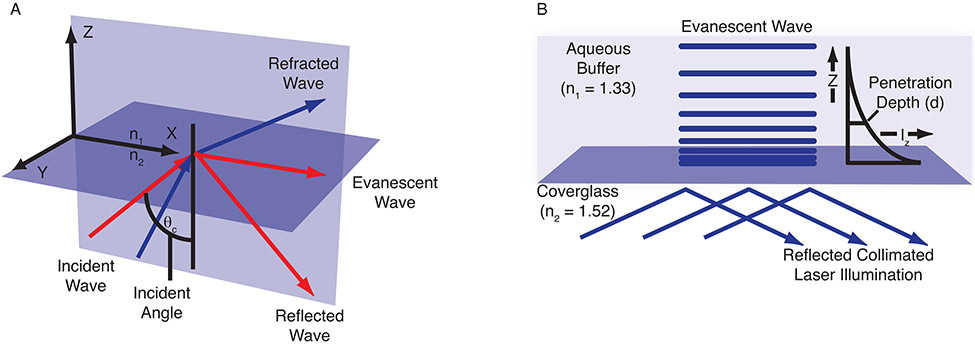
Figure 2.
The evanescent wave. (A) The incident angle can be described using a coordinate system arranged to display all three orthogonal directions. The x-y plane represents the interface between the coverglass and the cell cytosol. The plane of incidence is the x-z plane, which is parallel to the excitation light beam. (B) The evanescent field intensity decays exponentially with increasing distance from the interface according to Equation 3. The penetration depth, which is usually between 50 and 300 nm, decreases as the reflection angle grows larger and is dependent on the refractive indices at the interface and the illumination wavelength. Illustrations were adapted from ones provided by Michael W. Davidson, Florida State University.

