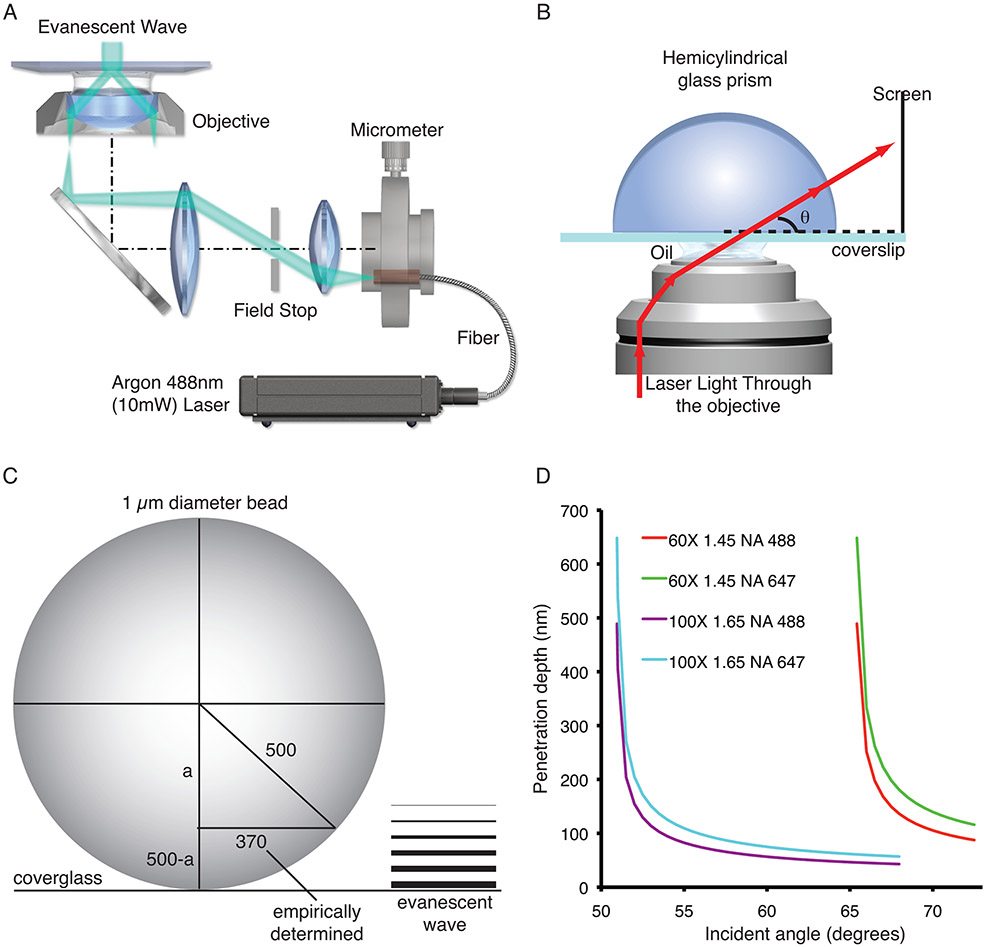
Figure 4.
TIRFM System calibration. (A) Schematic drawing of a TIRF microscope that uses a micrometer to position a fiber that delivers laser light to the microscope. (B) Schematic drawing of how to use a hemicylindrical glass prism to determine the angle of incidence. (C) Schematic drawing of how to empirically determine the penetration depth of the evanescent wave using 1-μm diameter fluorescent microspheres. Note that in the example 370 equals the measured radius of the microsphere and that a is calculated using the Pythagorean theorem and 500-a = the empirically determined penetration depth. (D) Demonstrates how the objectives numerical aperture and the illumination wavelength affect the penetration depth of the evanescent field. Panel A was provided by Michael W. Davidson, Florida State University.

