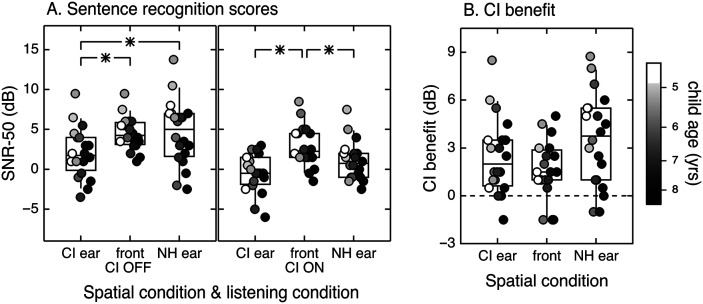
Figure 1.
Spatial release from masking. Distribution of SNR-50 plotted by spatial and listening conditions (A) and CI benefit in decibels plotted by spatial condition (B). Testing was completed with the device on and the device off, for three spatial configurations. Individual data are indicated with circles, and fill reflects age at testing, as defined in the legend. The center horizontal lines indicate the median, boxes span the 25th and 75th percentiles, and whiskers span the 10th and 90th percentiles. Significant differences are bracketed and indicated with an asterisk. CI = cochlear implant; NH = normal hearing; SNR = signal-to-noise ratio; yrs = years.

