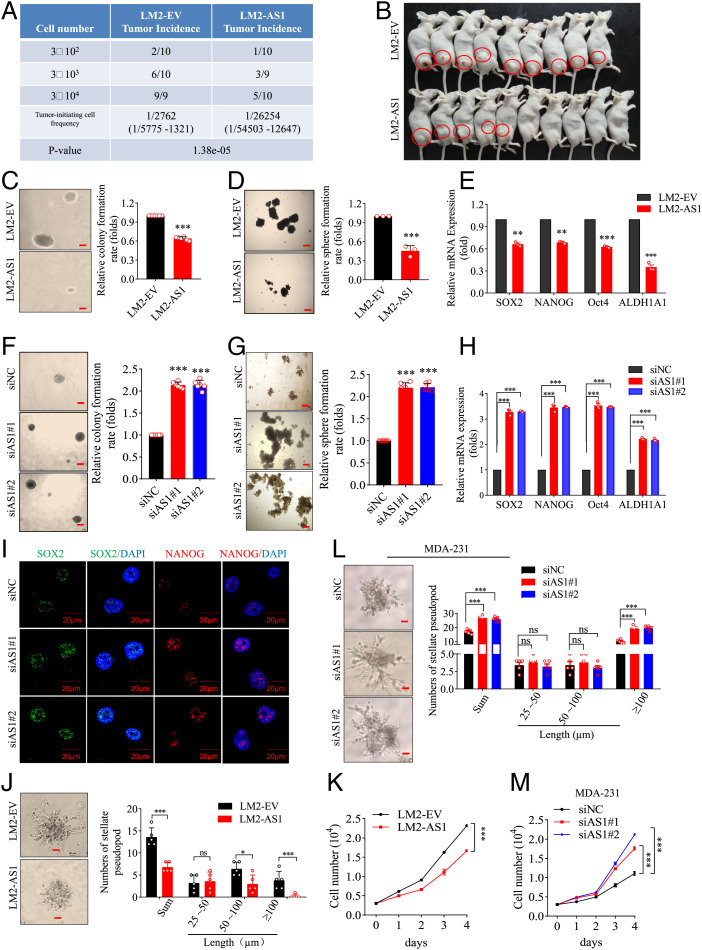
Fig. 3.
TGFB2-AS1 impairs breast cancer cell stemness. (A) LM2-AS1 and LM2-EV cells were diluted as indicated and subcutaneously implanted into BALB/c nude mice. Tumor-initiating cell frequency and P value for limiting dilution xenograft analysis was calculated on the website https://bioinf.wehi.edu.au/software/elda/. n = 9 or 10 for each group. (B) Representative image showing 3 × 10⁴ group of limiting dilution xenograft analysis. (C and D) Soft agar colony formation assay (C) and mammosphere assay (D) between LM2-EV and LM2-AS1 cells with images (Left; scale bar, 200 μm) and values (Right). (E) The expressions of stemness-related genes were detected in LM2-AS1 cells using qPCR. (F–I) Representative images (Left; scale bar, 200 μm) and values (Right) of soft agar colony formation assay (F). Representative images (Left; scale bar, 200 μm) and values (Right) of mammosphere assay (G), the expression of stemness-related genes detected using qPCR (H), and the representative images of immunofluorescence staining for SOX2 and Nanog (I) in TGFB2-AS1–silenced MDA-231 cells and their control cells (MDA-231-siNC). (J) Representative images (Left; scale bar, 50 μm) and values (Right) of the stellate pseudopod of LM2-EV and LM2-AS1 cells cultured on Matrigel on day 6. (K) Cell proliferation curves in LM2-EV and LM2-AS1 cells. (L) The images (Left; scale bar, 50 μm) and values (Right) of stellate pseudopod in TGFB2-AS1 silenced MDA-231 and their control cells cultured on Matrigel on day 8. (M) Cell proliferation curves in TGFB2-AS1–silenced MDA-231 cells. Error bars represent mean ± SD (n = 3 to 6). Statistical significance was assessed using two-tailed Student’s t test. *P < 0.05. **P < 0.01. ***P < 0.001. ns, not significant.

