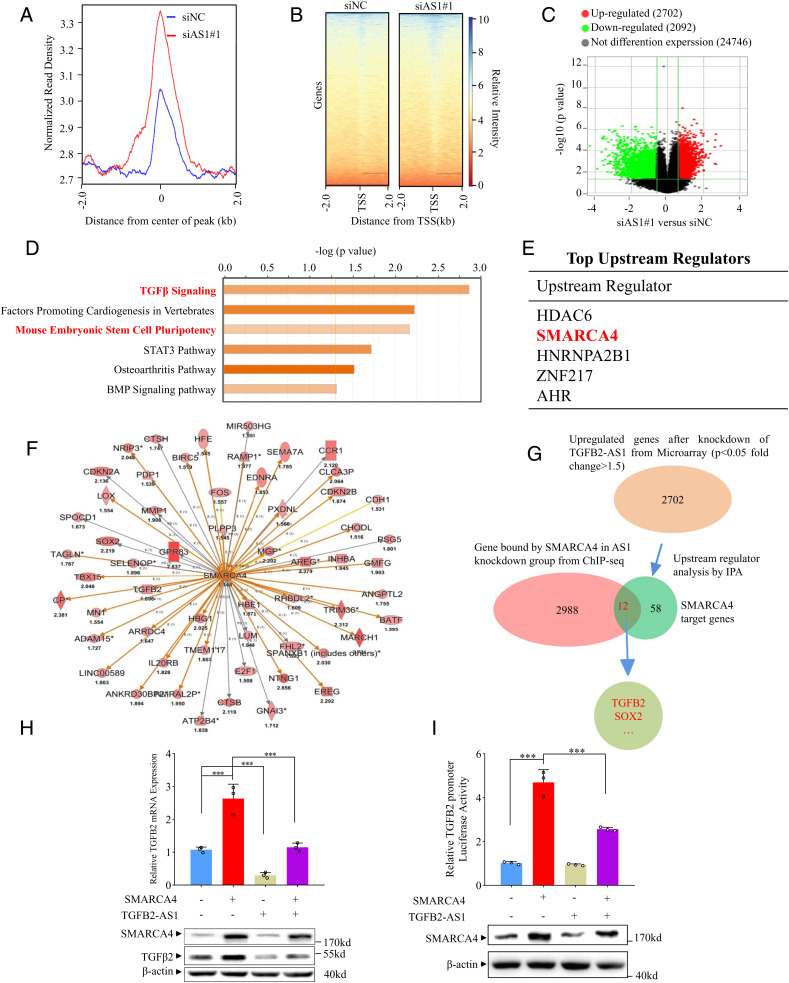
Fig. 5.
TGFB2-AS1 inhibits TGFB2 expression via sequestering SMARCA4 away from TGFB2 promoter. (A) Global representation of SMARCA4 genomic binding over a 4-kb window centered on SMARAC4 ChIP-seq peak in MDA-231 with siAS1 or siNC transfected. (B) The heat map of SMARCA4 genomic binding around the transcription start site (TSS) in MDA-231 with siAS1 or siNC transfected. (C) Volcano plots of mRNA expression profiles in MDA-231cells with TGFB2-AS1 knockdown and control group. Red dots represent up-regulated genes and green dots represent down-regulated genes (fold change ≥2). (D) Canonical signal pathway analysis via IPA using genes which are altered expression in microarray profiles and occupied by SMARCA4 in ChIP-seq data simultaneously in MDA-231 cells with TGFB2-AS1 knockdown. (E) Upstream regulators analysis by IPA using mRNA microarray data from TGFB2-AS1 knockdown MDA-231 cells and control cells. (F) Graph showing 58 up-regulated SMARCA4 target genes from IPA; the color depth is correlated to the fold change which is represented under each gene. Orange lines with arrows indicate activation, yellow lines with arrows depict inconsistent effects, and gray lines with arrows depict no prediction. (G) Schematic view of the identification of SMARCA4 regulated genes in MDA-231 cells with siAS1 transfected. (H) Real-time PCR and Western blot analysis show TGFB2 mRNA and protein expression in MDA-231 cells transfected with SMARCA4 or/and TGFB2-AS1 overexpression plasmids. (I) Luciferase reporter assay of chromatinized TGFB2 promoter in MDA-231 cells transfected with SMARCA4 or/and TGFB2-AS1 overexpression plasmids. Error bars represent mean ± SD (n = 3). Statistical significance was assessed using two-tailed Student’s t test. ***P < 0.001.

