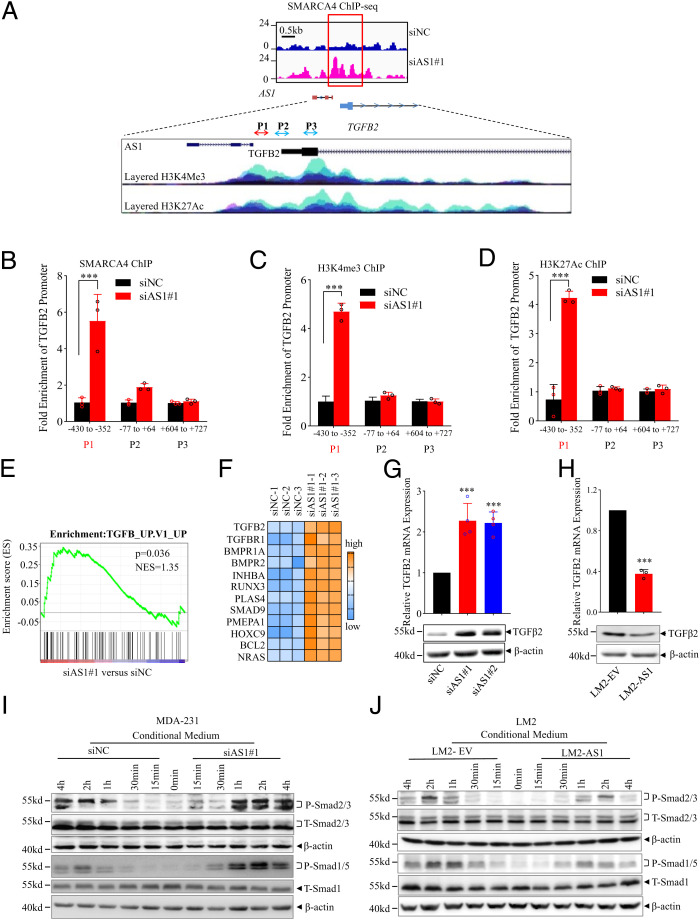
Fig. 6.
TGFB2-AS1 suppresses TGFβ2 signaling in TNBC cells. (A) Schematic view of SMARCA4 occupancy around TGFB2-AS1 and TGFB2 genomic locus from ChIP-seq in MDA-231 cells with knockdown of TGFB2-AS1. Blue indicates siNC group and pink indicates siB2-AS1 group. H3K4Me3 and H3K27Ac histone mark were displayed on four cell lines from ENCODE, on the layered H3K4Me3 and the layered H3K27Ac tracks respectively. Each color represents one cell line. (B) ChIP-qPCR shows the binding efficiency of SMARCA4 to the TGFB2 promoter region using three primers in MDA-231 cells transfected siAS1. (C and D) ChIP-qPCR shows the H3K4me3 and H3K27Ac levels of the TGFB2 promoter region using three primers in MDA-231 cells transfected siAS1. Error bars represent mean ± SD (n = 3). (E) GSEA of microarray profiles from MDA-231 with TGFB2-AS1 knockdown matching with TGFβ activated gene set. (F) Heat-map representation of up-regulated genes relating TGFβ signaling pathway in TGFB2-AS1 knockdown group comparing control group from IPA. RT-PCR and Western blot assay show TGFB2 mRNA and protein expression in MDA-231 cells after transfected with two TGFB2-AS1 siRNAs (G) and LM2 cells overexpressed TGFB2-AS1 (H). Western blot analysis shows P-SMAD2/3 and P-SMAD1/5 protein levels after treated with CM collected from MDA-231 cells after TGFB2-AS1 knockdown (I) or LM2 cells TGFB2-AS1 overexpression (J), and SMAD1/5, SMAD2/3, and β-actin work as internal control. Error bars represent mean ± SD (n = 3). Statistical significance was assessed using two-tailed Student’s t test. ***P < 0.001.

