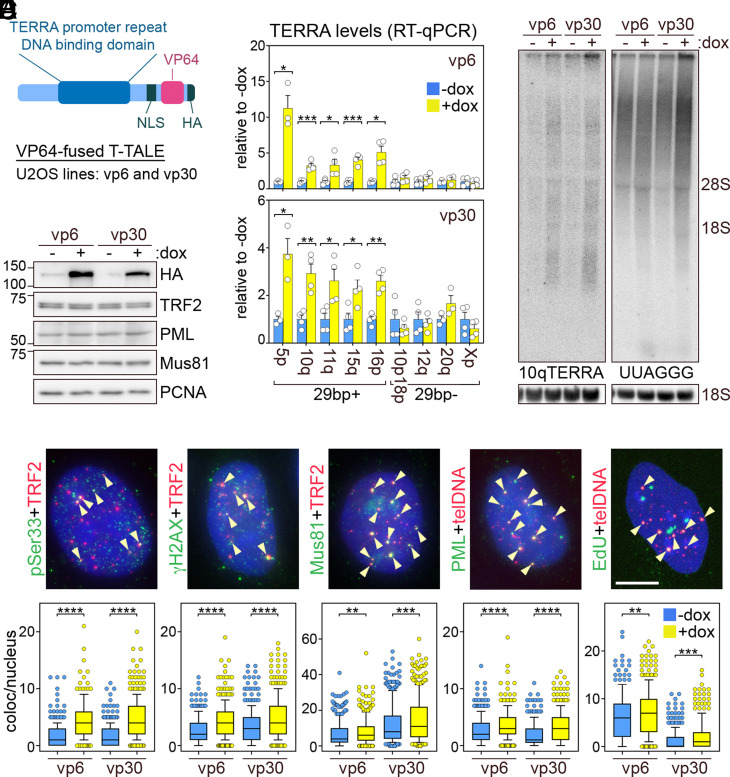
Fig. 1.
(A) Schematic representation of T-TALEs. (B) Western blot of T-TALEs (anti-HA antibody) and proteins analyzed throughout the study. Cells were treated with dox for 24 h. PCNA is the loading control. (C) The qRT-PCR quantifications of TERRA transcripts from 29-bp-containing (+) and 29-bp-devoid (−) subtelomeres in cells as in B. Values are normalized to −dox. Bars and error bars are means and SEMs from three or four independent experiments. Circles are single data points. Asterisks are P values (two-tailed Student’s t test). (D) Northern blot of 10qTERRA or total UUAGGG repeats in cells as in B. The positions of 28S and 18S ribosomal RNAs (rRNAs) are on the right. The 18S rRNA hybridization is the loading control. (E) Examples of pSer33, γH2AX, Mus81, and PML indirect immunofluorescence (IF) or EdU click-it staining (green) combined with TRF2 IF or telomeric DNA FISH (red) in cells as in B. Nuclear DNA is in blue. Arrowheads point to colocalization events. (Scale bar, 10 μm.) Box plots represent the 10th to 90th percentile of colocalization events per nucleus. Central lines are medians. At least 306 nuclei from three independent experiments were analyzed for each sample. Asterisks are P values (Mann–Whitney U test). *P < 0.05, **P < 0.005, ***P < 0.001, ****P < 0.0001.

