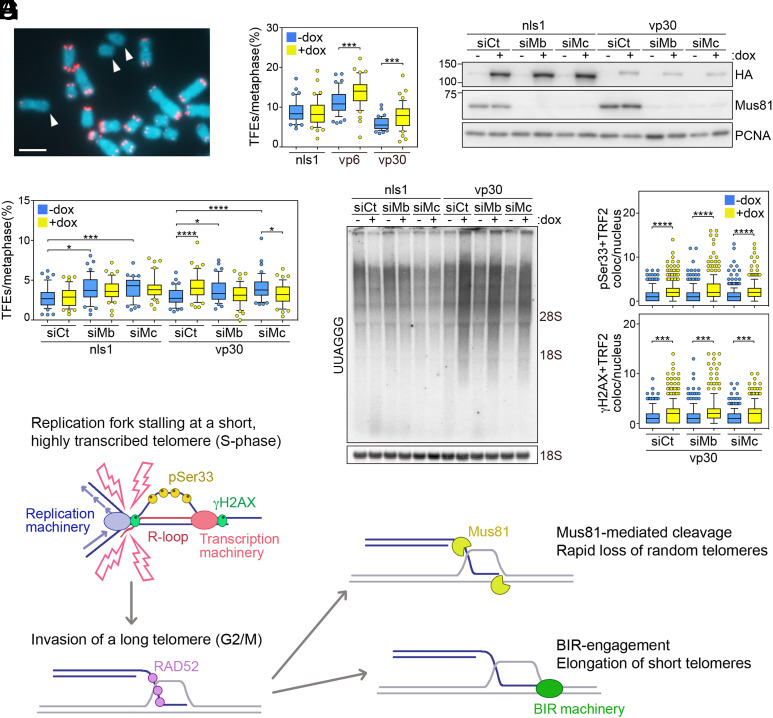
Fig. 2.
(A) Example of telomeric DNA FISH utilized to score TFEs (arrowheads). Chromosomes are from dox-treated vp30 cells. Telomeric DNA is in red; chromosomal DNA is in blue. (Scale bar, 5 μm.) (B) Box plots of the 10th to 90th percentile of TFEs per metaphase in cells treated with dox for 9 d. (C) Western blot of T-TALE (HA) and Mus81 levels in cells transfected with Mus81 (siMb and siMc) or control siRNAs (siCt). Cells were harvested 78 h after transfection. Where indicated, dox was included in the medium 6 h after transfection and remained until harvesting. PCNA is the loading control. (D) Box plots of the 10th to 90th percentile of TFEs per metaphase in cells as in C. For graphs in B and D, at least 2,596 chromosomes from three independent experiments were analyzed for each condition. (E) Northern blot of total UUAGGG repeats in cells as in C. The positions of 28S and 18S rRNAs are on the right. The 18S rRNA hybridization is the loading control. (F) Box plots of the 10th to 90th percentile of events of colocalization of pSer33 or γH2AX with TRF2 per nucleus in cells as in C. At least 303 nuclei from three independent experiments were analyzed for each sample. For all box plots, central lines are medians, and P values (Mann–Whitney U test). *P < 0.05, ***P < 0.001, ****P < 0.0001. (G) Model for the ALT mechanism (see text for details). Pink lightning denotes replication stress.

