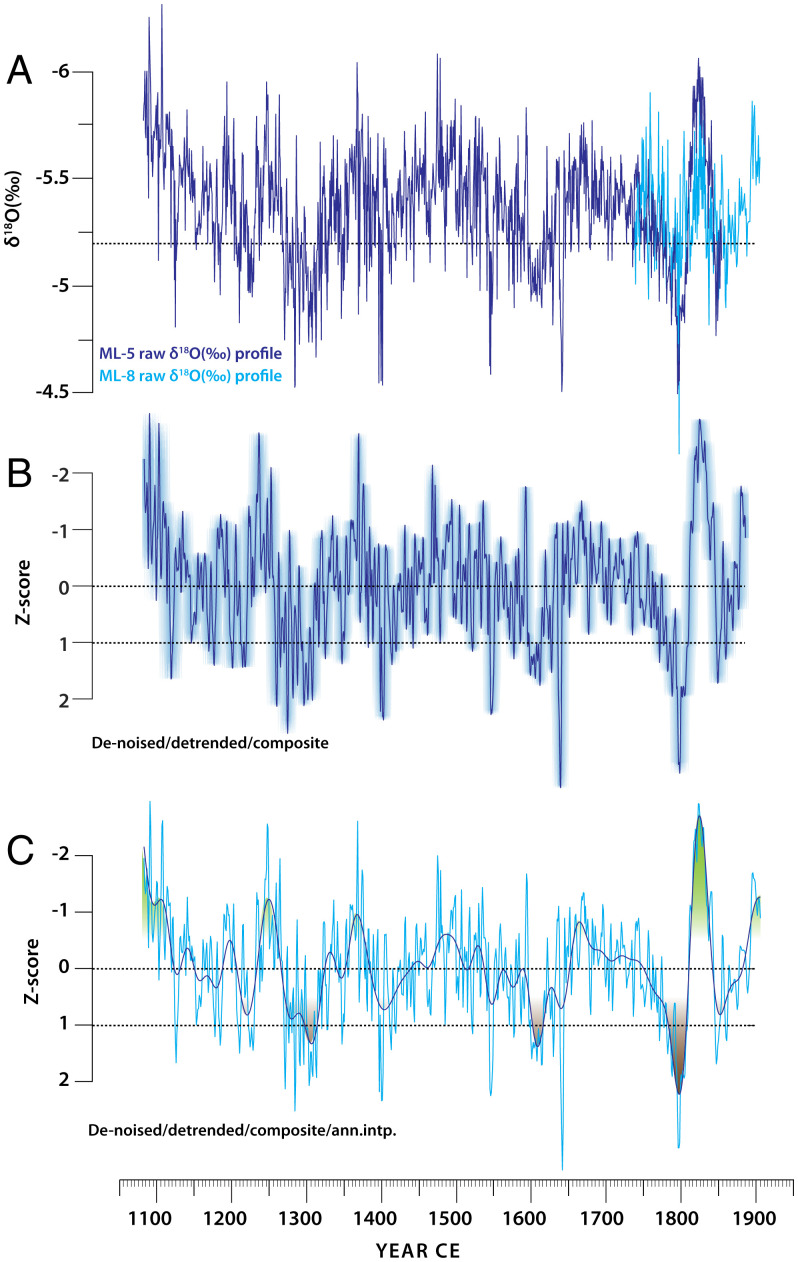
Fig. 1.
Mawmluh cave speleothem δ18O records. (A) Raw δ18O profiles of ML-5 (indigo) and ML-8 (cyan) on their independent age models. The mean δ18O value is indicated by a horizontal dotted line. The ML-5 and ML-8 δ18O profiles were subsequently combined by stacking on a common age scale (see SI Appendix, Fig. S4 and Materials and Methods). (B) The denoised, detrended, and z-score-transformed MAW profile (indigo) is shown along with the 1σ age uncertainty based on the Monte Carlo results from COPRA (shaded) (26) (Materials and Methods). The median age was selected as the final age model (SI Appendix, Fig. S3 and Materials and Methods). The high-frequency (∼1 to 2 y) noise and long-term (>200 y) nonlinear trends were removed by using the ensemble empirical mode decomposition (55) and singular spectrum analysis (56) (SI Appendix, Fig. S5 and Materials and Methods). (C) Annually interpolated MAW profile (from B) on its median age (cyan) overlain by a 30-y low-pass Butterworth filter (indigo). Shades of brown and green delineate multidecadal periods of inferred droughts (z-score >1) and pluvial conditions (z-score <−1).

