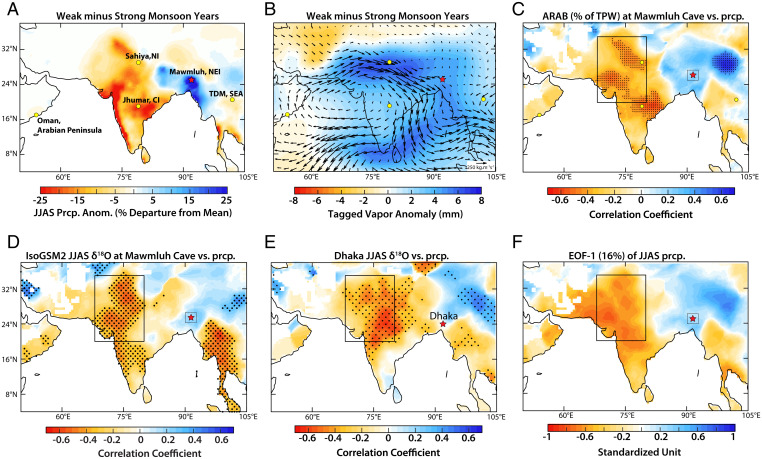
Fig. 2.
Spatial patterns of climate field anomalies and proxy locations. (A and B) Spatial patterns of JJAS anomalies (weak monsoon minus strong monsoon years) from the monthly Climatic Research Unit (CRU) TS4.03 (57) and tagged Arabian Sea moisture (ARAB) anomalies are shown as fractions of total precipitable water (% TPW, shaded, from ref. 29) overlain by the vertically integrated moisture flux anomalies (black arrows) (28). (C) The inverse field correlations between the JJAS ARAB (% TPW) extracted from the grid points nearest to Mawmluh cave (small square) and precipitation amount at all other grid points (58). Note that the increased flux of 18O-enriched ARAB moisture over NEI India is associated with reduced rainfall over the rest of the Indian subcontinent. (D) Same as C, but for simulated JJAS precipitation oxygen isotope (δ18Op) data extracted from the grid points nearest to Mawmluh cave (28) and precipitation amount (57). Note that the higher (lower) δ18O values over NEI are associated with reduced (increased) rainfall over the rest of the Indian subcontinent. (E) Same as D but for spatial correlations between the observed amount weighted JJAS δ18Op at Dhaka and the precipitation amount at other grid points for the period from 2009 to 2016 (see ref. 29 for details). (F) The first Empirical Orthogonal Function (EOF) mode of normalized JJAS precipitation (57) over the region 38°N to 4°S and 50°W to 105°E. The EOF-1 (explained variance ∼16%) shows a precipitation dipole akin to the observed weak minus strong pattern of JJAS rainfall anomalies as in A. The locations of Mawmluh cave (red star), other cave records (yellow dots), and Dhaka (red star) are shown in different panels. Stippling in C–E indicates regions of significant correlations at the 95% significance level obtained after accounting for serial correlations in data at each grid point followed by the application of the FDR procedure (58) with a 5% threshold (Materials and Methods). FDR is the expected proportion of rejected hypotheses when the null hypothesis is true for those tests. Large black rectangles (∼20°N-35°N; 68°E-80°E and small squares ∼27°N-23°N; 90°E-94°E) in C–F demarcate the region where the JJAS precipitation amount is strongly and inversely correlated to the model-derived δ18Op and tagged ARAB (% TPW) extracted from the grid cell nearest to Mawmluh cave. These time-series comparisons are shown in SI Appendix, Fig. S6.

