Fig. 1.
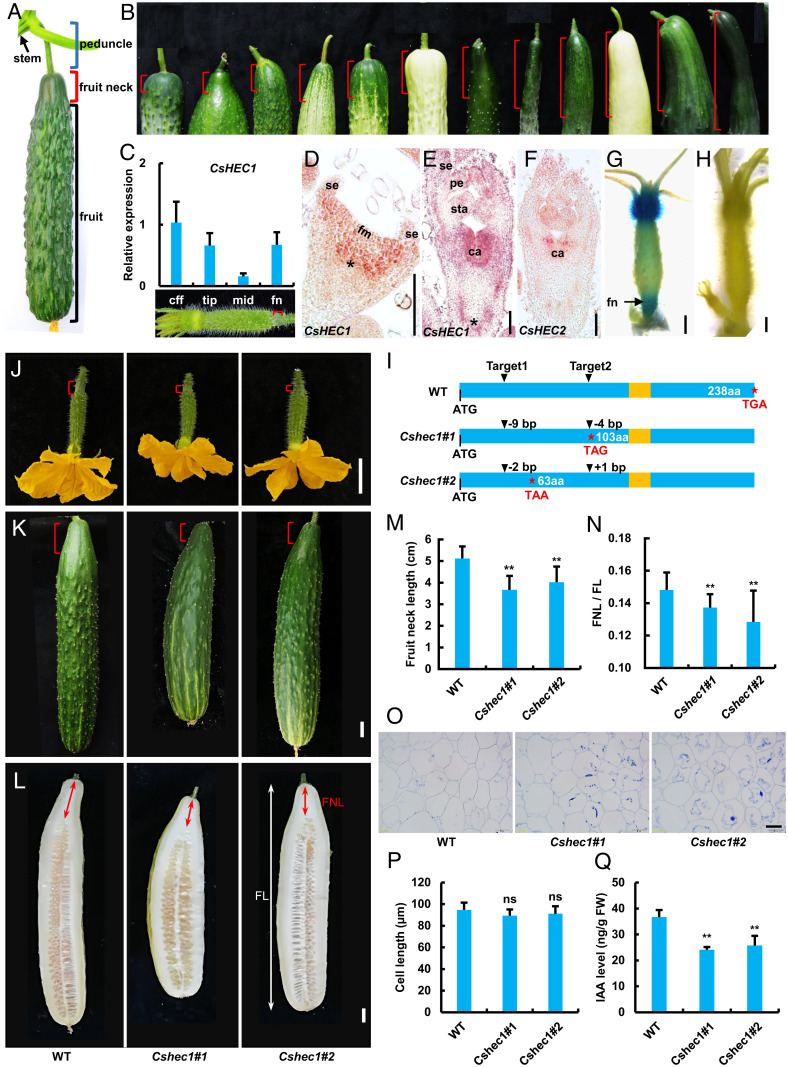
Expression analysis of CsHEC1 and phenotypic characterization of CsHEC1 knockout lines in cucumber. (A) Structure of cucumber fruit at the commercial harvest stage. Blue bracket, peduncle; red bracket, fruit neck; black bracket, fruit. (B) Variations in FNL (red brackets) in different cucumber germplasms. (C) The expression pattern of CsHEC1 in different parts of the ovary at 3 DBA. cff, corolla from the female flowers; fn, fruit neck; mid, middle. Values are means ± SD (n = 3). The red brackets indicate the fruit neck. (D–F) In situ hybridization analysis of CsHEC1 (D and E) or CsHEC2 (F) in cucumber. Longitudinal sections of developing flower primordium at stage 2 (D) and stage 6 (E and F). Asterisks indicate the developing fruit neck in cucumber. ca, carpel; fm, floral meristem; pe, petal; se, sepal; sta, stamen. (Scale bars, 100 µm.) (G and H) Tissue specificity of CsHEC1 expression was examined using the ProCsHEC1:GUS reporter system. GUS signals of CsHEC1 were highly enriched at the fruit neck and corolla of the female flower (G). Negative control showed no GUS signal (H). (Scale bars, 1 mm.) (I) Genotype identification of CsHEC1 knockout plants indicated the Cshec1#1 mutant with 9- and 4-bp deletions, and the Cshec1#2 mutant with a 2-bp deletion and 1-bp insertion. The stars represent the termination codon position and the yellow boxes indicate the bHLH domain. (J–L) Morphology of WT, Cshec1#1, and Cshec1#2 fruits at 0 DPP (J), 10 DPP (K), and 40 DPP (L). The red brackets indicate the fruit neck; the red and white double arrows represent the measured FNL and FL, respectively. (Scale bars, 2 cm.) (M and N) Quantification of FNL (M) and the ratio of FNL/FL (N) in WT and Cshec1 mutants at 40 DPP. Values are means ± SD (n = 10). (O and P) Representative cell morphology (O) and cell-length quantification (P) of longitudinal sections of the fruit necks in WT and Cshec1 fruits at 40 DPP. Values are means ± SD (n = 9). (Scale bar, 50 µm.) (Q) IAA content in the fruit necks of WT and Cshec1 mutants. FW, fresh weight. Values are means ± SD (n = 3). Significance analysis compared with WT was performed with the two-tailed Student’s t test (ns, no significant difference; **P < 0.01).

