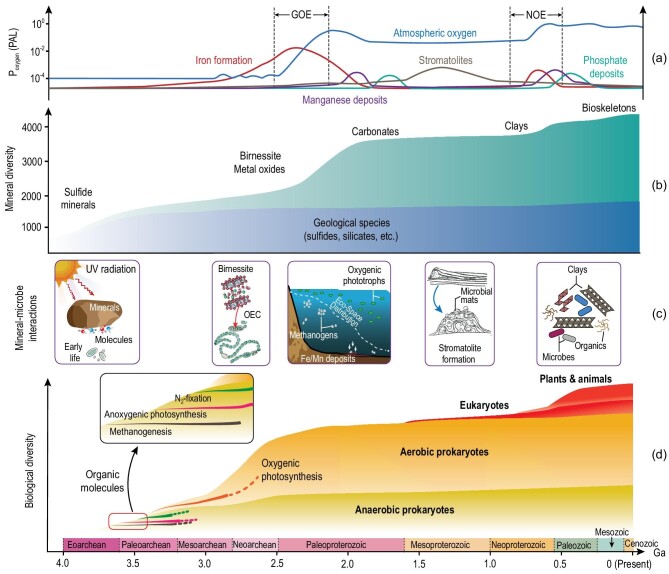
Figure 3.
Mineral–microbe co-evolution. (a) Evolution curves of atmospheric oxygen content [89], iron formations [90], Mn deposit [91] and phosphorite deposit [92]. Mineral–microbe interactions play important roles in sequential formation of Fe, Mn and P deposits around the Great Oxidation Event (GOE) and the Neoproterozoic Oxygenation Event (NOE). PAL: present atmospheric level. (b) Simplified mineral evolution sequence showing important groups of minerals [4]. The geological species refer to those high temperature minerals that were present before the origination of life. The green shade refers to those that have interactions with life. The positions of these major groups of minerals in the green shade denote the approximate times their diversity increases. The sum of the two categories is approximately equal to the total number of mineral species. (c) A few important examples of mineral–microbe interactions over time. On early Earth, sulfide minerals serve as catalysts and protectants of molecules and early life. Mineral–microbe interactions drive the GOE through (i) the role of a birnessite-like mineral in origination of oxygenic photosynthesis through its catalytic function in the oxygen evolving complex (OEC); (ii) a decrease of toxic ROS production through anaerobic oxidation of Fe(II) to Fe(III) minerals so that oxygenic phototrophs flourish; (iii) time-course expansion of the eco-space of oxygenic phototrophs and shrinkage of methanogens. Mineral–microbe interactions are also important in stromatolite formation during the Boring Billion (mid-Proterozoic). Around the NOE, sequestration of organic carbon by clay minerals results in a further rise of O2. (d) Evolution of a few important groups of microorganisms. Biological diversity is only schematic. The time of eukaryote emergence is based on Ref. [93]. Eukaryotes (the whole red-shaded region) include plants and animals (the upper portion of the red-shaded region). The boundaries among different geological time units are based on the latest published data (https://stratigraphy.org/ICSchart/ChronostratChart2022-02.pdf).

