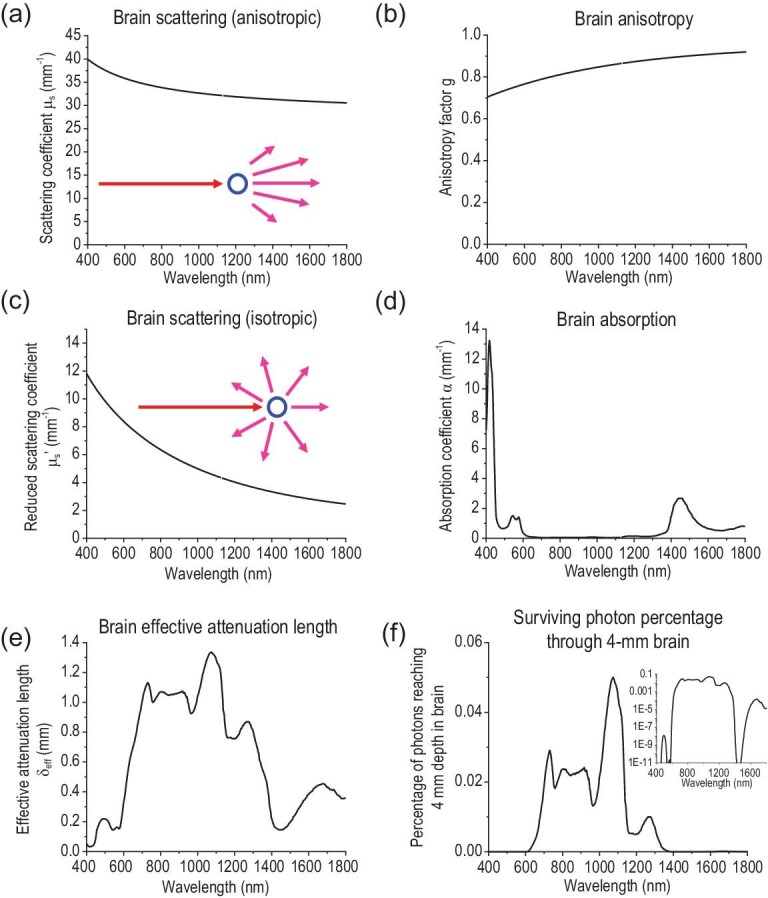
Figure 1.

Wavelength-dependent optical properties of the brain. The (a) scattering coefficient μs, (b) anisotropy factor g, (c) reduced scattering coefficient μs’, (d) absorption coefficient α, (e) effective attenuation length and (f) the percentage of photons surviving 4-mm brain tissue are plotted as a function of wavelength in the 400–1800 nm optical spectrum. The insets in (a) and (c) indicate anisotropic and isotropic scattering, respectively. The inset in (f) represents the same graph plotted in logarithmic scale. The data in (a–c) are from ref. [24], the data in (d) are reproduced from ref. [19] and the data in (e) and (f) are calculated from Equations 7 and 9, respectively.
