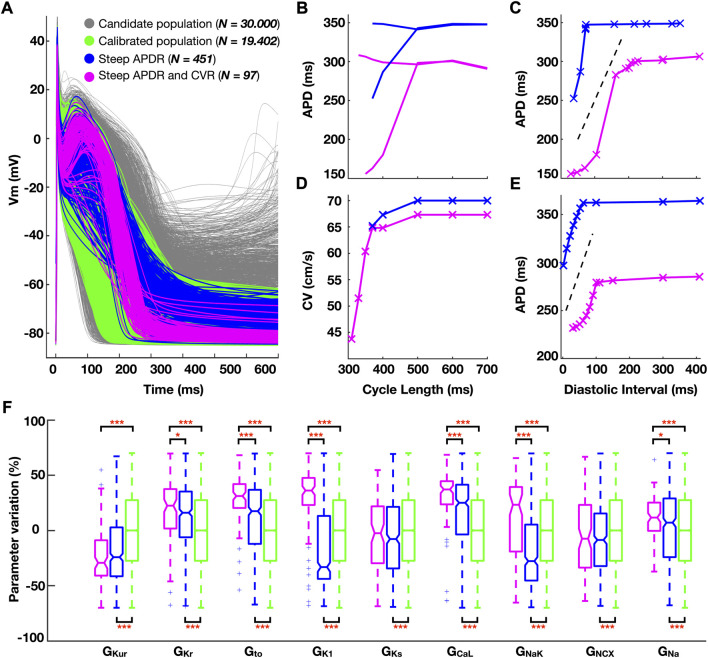
FIGURE 1.
(A) Simulated action potential traces for human atrial cardiomyocyte models in the population before (grey) and after (green) experimental calibration. (B–E) Comparison of the electrical restitution between a representative cardiomyocyte model characterized by steep action potential duration restitution (APDR) alone (blue) and additional steep conduction velocity restitution (CVR, pink). (B) Dynamic APDR plotted against the cycle length, showing transient alternation, and (C) against the diastolic interval. (D) CVR. (E) Standard S1S2 APDR. (F) Ionic density distribution (color-code as per panel (A). Data analyzed using Wilcoxon test. *p < 0.05, **p < 0.01, ***p < 0.001.

