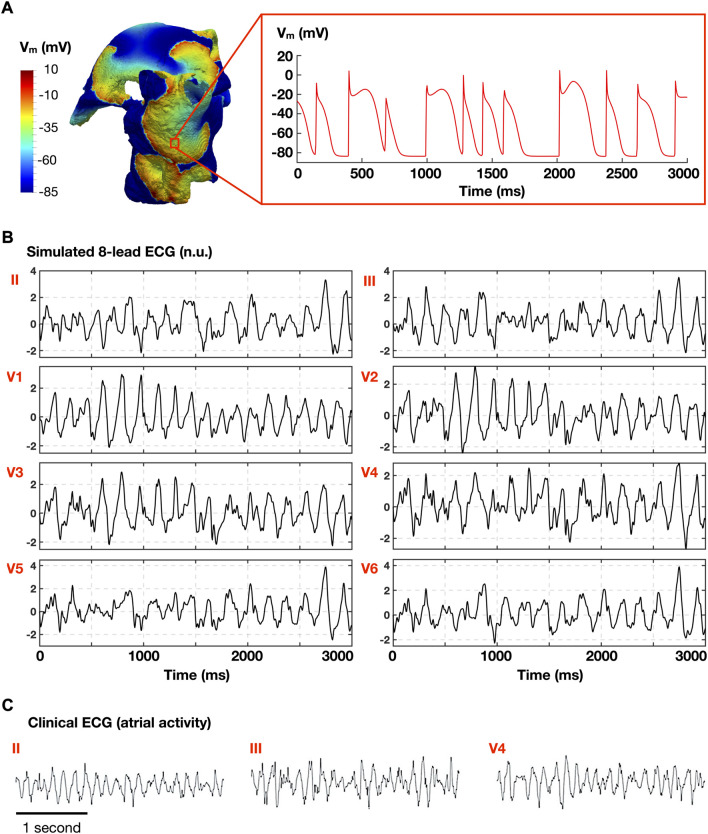
FIGURE 2.
Representative atrial fibrillation (AF) episode. (A) Simulated AF in the whole atria model (left), and time course of the transmembrane voltage (Vm) in 1 cell (right). (B) Simulated atrial electrocardiogram (normalized ECG; no units). (C) Clinical ECG obtained in AF patient (adapted from Lankveld et al., 2016 under permission).

