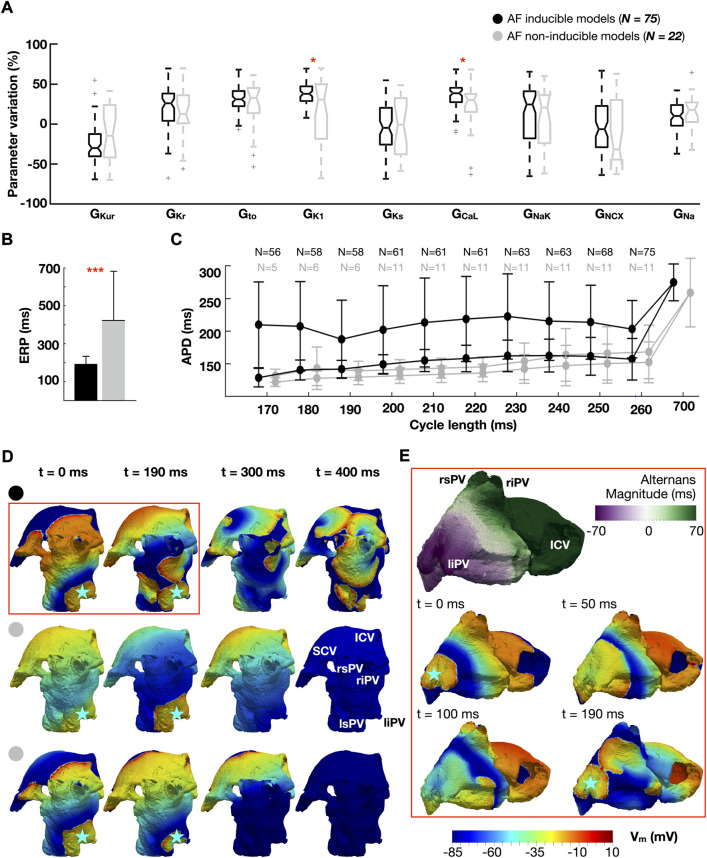
FIGURE 3.
Ionic properties of AF-inducible (black) and non-inducible models (grey): (A) Ionic density distributions. (B) Effective refractory period (ERP). (C) Dynamic action potential duration (APD) restitution curves plotted against the cycle length used for burst pacing (170–260 ms). Two consecutive beats are considered (i.e., long and short APD), showing magnitude of APD alternans. Number (N) of models able to propagate all stimuli. (D) Comparison of propagation dynamics between an AF-inducible model (top), and two non-inducible models: one showing a 1:2 conduction pattern (middle row), the other propagating all stimuli without AF induction (bottom row). Burst stimulus applied at a cycle length of 190 ms. The blue star represents the location of the burst. (E) Discordant alternans favoring conduction block and re-entry. The snapshots in (E) are an expansion of the red box in (D). Abbreviations. S-ICV: Superior and inferior cava vein; ri-rs-li-ls-PV: Right inferior, right superior, left inferior and left superior pulmonary veins. Data are expressed as medians and IQR and analyzed using Wilcoxon Test. *p < 0.05, **p < 0.01. ***p < 0.001.

