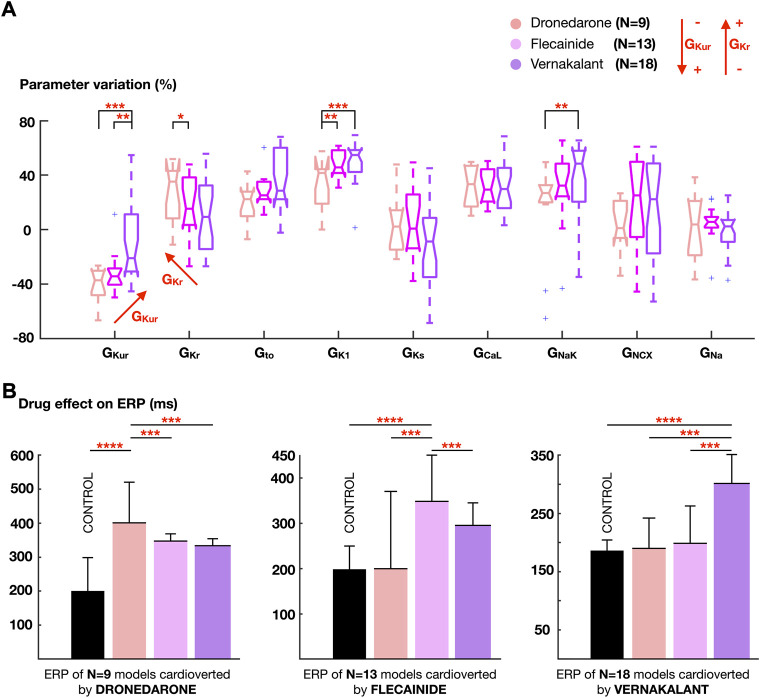
FIGURE 6.
(A) Comparison of the ionic density distribution between atrial cardiomyocyte models showing favorable response only to dronedarone, flecainide or vernakalant. (B) Effect of the three antiarrhythmic drugs on the effective refractory period (ERP), stratifying the atrial cardiomyocyte models according to the pharmacological treatment that produced successful cardioversion. Colors on the bars as in (A). Data are expressed as medians and IQR and analyzed using Wilcoxon Test. *p < 0.1, **p < 0.05, ***p < 0.01. ****p < 0.001.

