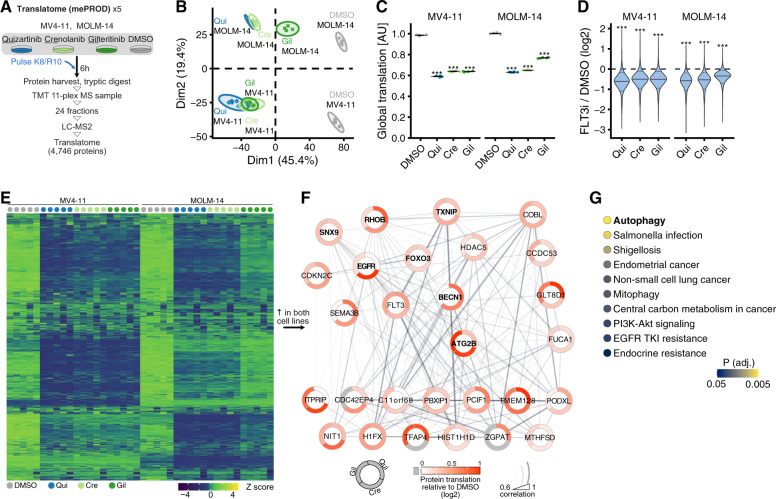
Fig. 1. Global translatome proteomics identifies changes in the nascent proteome upon FLT3-ITD inhibition.
A Experimental layout. FLT3-ITD + AML cell lines MV4-11 and MOLM-14 were treated with 10 nM quizartinib (Qui), crenolanib (Cre), gilteritinib (Gil) or DMSO control for 6 h (h) in Lys8- and Arg10-containing SILAC-heavy medium (n = 5). B Principal component analysis of all conditions and replicates. Dim, dimension. C Summed abundances of all newly translated, SILAC-heavy labeled proteins following FLT3 inhibitors (FLT3i) relative to DMSO control. Values are scaled such that the overall mean of each cell line’s DMSO condition is 1. Horizontal bars indicate mean, error bars show SEM; P values by two-sided paired t-test against DMSO (***P < 0.001). AU, arbitrary units. D Distribution of log2 fold changes (FC) relative to DMSO controls. Thick line depicts the median log2 FC, dashed lines depict the 10th/90th percentiles. P values were obtained by testing the log2-transformed SILAC-heavy protein abundances (averaged across replicates) between DMSO and FLT3i conditions using a two-sided paired t-test (***P < 0.001). E Heat map showing row-scaled Z scores for all measured proteins across all conditions. F Network of proteins upregulated in both cell lines following FLT3i. Nodes are proteins, circle segments around nodes indicate the average log2 FC for each FLT3 inhibitor, line strength between any two nodes is scaled by the pairwise Pearson correlation coefficient. Autophagy-related proteins are manually highlighted by bold typeface. G KEGG pathway analysis on network nodes from F. All significant (P < 0.05, adjusted for multiple testing by g:SCS) annotations are shown. See also Supplementary Fig. 1.

