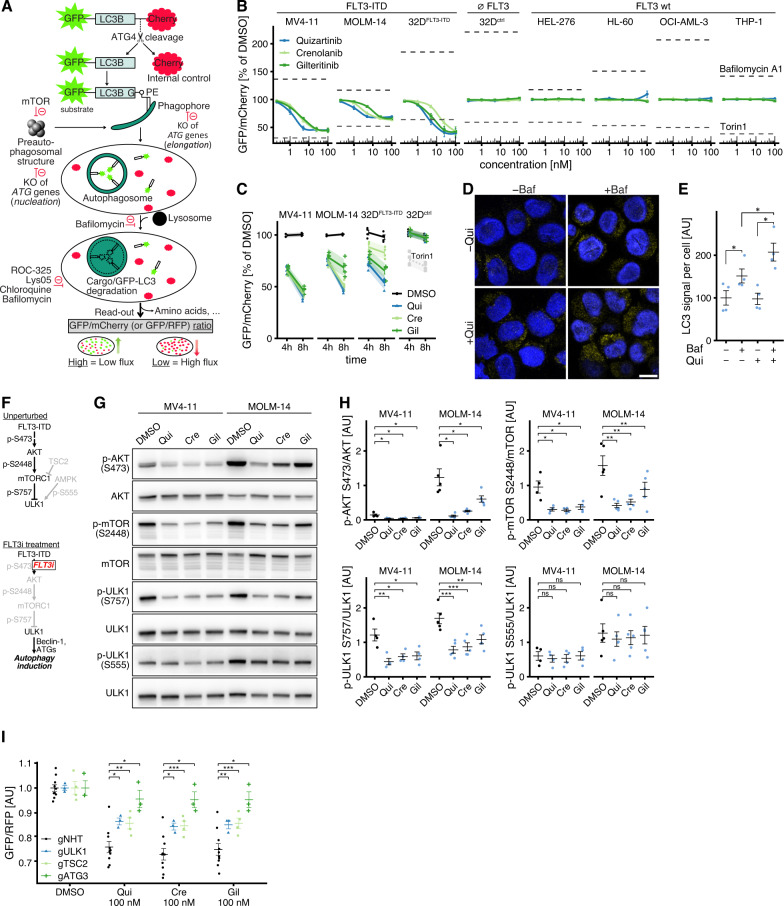
Fig. 3. FLT3 inhibitors induce autophagy via AKT/mTORC1/ULK1 and ATG3.
A Cells were engineered to constitutively express a ratiometric autophagic flux reporter, GFP-LC3B-mCherry or GFP-LC3B-RFP. Following cleavage by ATG4B after translation, GFP-LC3B is incorporated into nascent autophagosomes and degraded in an autophagy-dependent manner, whereas mCherry (or RFP) remains in the cytosol. A decrease in GFP/mCherry ratio indicates an increase in autophagic flux, whereas an increase in GFP/mCherry ratio is evidence of a decrease in autophagic activity. Loss of essential autophagy genes (ATGs) or lysosomal inhibitors block autophagic cargo degradation. B Flow cytometry measurements of GFP-LC3B/mCherry relative to DMSO control in various cells lines expressing either FLT3-ITD (MV4-11, MOLM-14, 32D-FLT3ITD; n = 4), FLT3 wildtype (HEL-276, HL-60, OCI-AML-3, THP-1; n = 3) or no FLT3 (32D-ctrl; n = 4) after 6 h treatment with quizartinib, crenolanib or gilteritinib at 0.2–100 nM. Bafilomycin A1 (100 nM) and Torin1 (1000 nM) served as negative and positive controls. Dots indicate mean, error bars show SEM. C Flow cytometry measurements of GFP-LC3B/mCherry relative to DMSO after 4 h and 8 h of treatment with 10 nM quizartinib (Qui), crenolanib (Cre) or gilteritinib (Gil) in MV4-11 (n = 4), MOLM-14 (n = 4), 32D-FLT3ITD (n = 4) and 32D-ctrl (n = 4) cells. Torin1 (100 nM) was used as a positive control. Points indicate individual measurements normalized to the mean of DMSO-treated cells, error bars denote SEM, shaded regions show 95 % confidence intervals. D Representative confocal microscopy images (z slices) of MV4-11 cells immunostained against endogenous LC3A/B after 100 nM quizartinib (Qui) or DMSO vehicle for 4 h, ±concurrent inhibition of autophagosomal LC3 degradation by 100 nM Bafilomycin A1 (Baf) for 4 h. The scale is identical for all images. Scale bar (lower right) measures 10 µm. E Quantification of cytosolic LC3 signal (n = 4). The accumulation of LC3 upon concurrent Bafilomycin treatment is dependent upon autophagic flux. Values are scaled such that the overall mean of untreated samples is 100. Points indicate means from individual experiments, horizontal bar denotes overall mean, error bars show SEM; P values by two-sided paired t-test (*P < 0.05). F Pathway diagrams showing the AKT-mTORC1-ULK1 axis with its main catalytic/regulatory phosphosites under unperturbed growth conditions (upper) and FLT3 inhibitor treatment (lower), as investigated in the next panels. G Representative immunoblots of lysates from MV4-11 and MOLM-14 cells treated with 10 nM quizartinib, crenolanib, gilteritinib or DMSO control for 4 h. H Densitometric quantification of g (MV4-11: n = 4; MOLM-14: n = 5). Horizontal bar indicates mean, error bars show SEM; P values by two-sided paired t-test (*P < 0.05, **P < 0.01, ***P < 0.001, not significant (ns) P ≥ 0.05). I Flow cytometry measurements of GFP-LC3B/RFP in MV4-11 Cas9 cells transduced with gRNA against ULK1, TSC2, ATG3 or non-human target (NHT) and treated with DMSO control or 100 nM quizartinib, crenolanib or gilteritinib for 4 h (gULK1, n = 3; gTSC2, n = 4; gATG3, n = 4). Values are scaled such that the overall mean of each genotype’s DMSO condition is 1. Horizontal bar indicates mean, error bars show SEM; P values by two-sided paired t test (*P < 0.05, **P < 0.01, ***P < 0.001). See also Supplementary Fig. 9.

