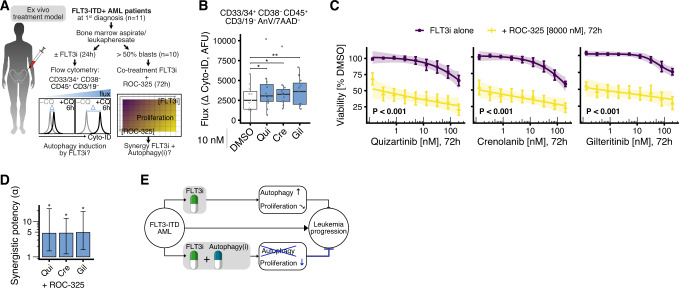
Fig. 6. FLT3-targeted therapy induces autophagy in primary FLT3-ITD + AML patient cells and inhibition of drug-induced autophagy is synergistically cytotoxic.
A Ex vivo treatment model, schematic overview. Primary AML cells (bone marrow aspirate or leukapheresate) obtained from untreated FLT3-ITD + AML patients at first diagnosis were assayed for autophagy induction by FLT3 inhibitors (FLT3i) and synergistic anti-proliferative effects of co-treatment with lysosomal autophagy inhibitor ROC-325 and FLT3i. Hematopoietic cytokines FLT3 ligand (FL), interleukin 3 (IL3) and stem cell factor (SCF) act as FLT3i resistance factors in vivo and were added to the culture medium. B Quantification of autophagic flux in primary AML cells (CD33/34+ CD38- CD45+ CD3/CD19- Annexin V/7AAD-) after 24 h treatment with 10 nM quizartinib (Qui), crenolanib (Cre), gilteritinib (Gil) or DMSO vehicle control, as measured by the difference in median Cyto-ID signal between chloroquine (CQ) co-treated cells (60 µM, last 6 h) and cells without additional CQ treatment (n = 11). Data are additionally summarized by boxplots (horizontal bar inside boxplot indicates median, box extends from the 25th to the 75th percentile, whiskers extend to the highest/lowest value within 1.5× inter-quartile range of the data). P values by two-sided paired t test (* P < 0.05, ** P < 0.01). C 72 h endpoint viability relative to DMSO vehicle control of all patient samples with AML blast percentage >50% co-treated with FLT3i and ROC-325 (n = 10). Dots indicate mean, error bars show SEM, shaded regions indicate 95% confidence interval of the four-parameter log-logistic dose-response models; P values by F test (*** P < 0.001). See also Supplementary Fig. 18. D Quantification of synergistic potency α in endpoint viability assays. Error bars indicate non-parametric 95% confidence intervals. α values with confidence intervals > 1 (significant synergistic potency) are marked by an asterisk. E Schematic representation of the combination treatment and its synergistic antileukemic action.

