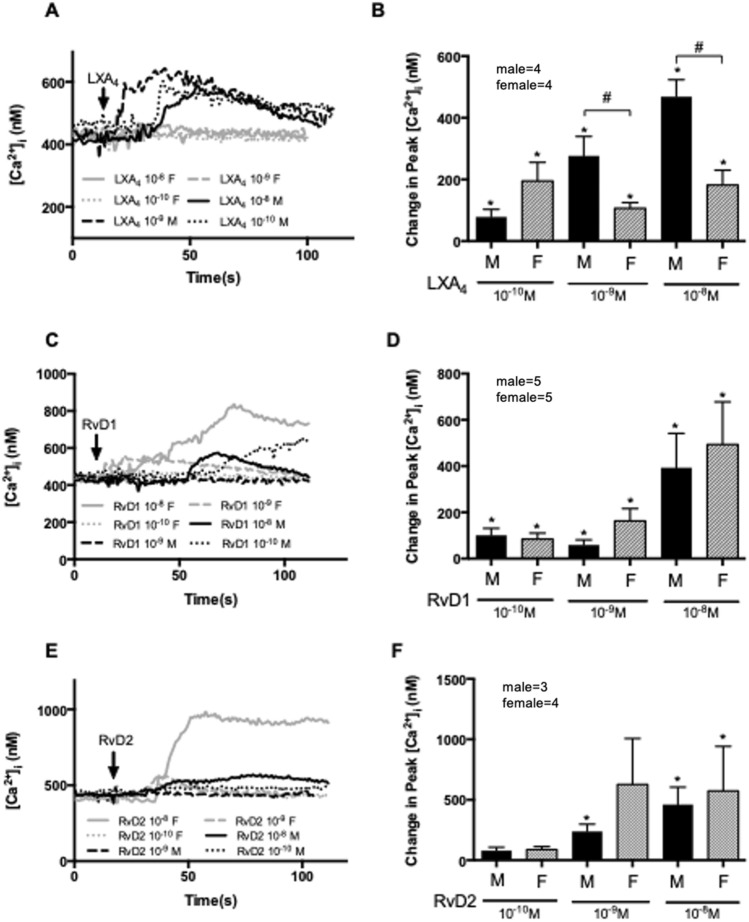
Figure 7.
Cultured conjunctival goblet cell Ca2+ response to LXA4 from male is greater than female cells. Goblet cells from both sexes were stimulated with LXA4 10–10–10−8 M (A and B) RvD1 10–10–10−8 M (C and D) or RvD2 10–10–10−8 M (E and F). [Ca2+]i was measured by fura2 assay. The average [Ca2+]i level over time was shown in (A, C and E). Change in peak [Ca2+]i was calculated and shown in (B, D and F). Data are mean ± SEM, the number of individuals is marked in each graph. Arrow indicates the addition of stimuli. Black lines and solid bars indicate data from male cells. Grey lines and slash-patterned bars and indicate data from female cells. *Significance difference from basal. #Significance difference between males and females.

