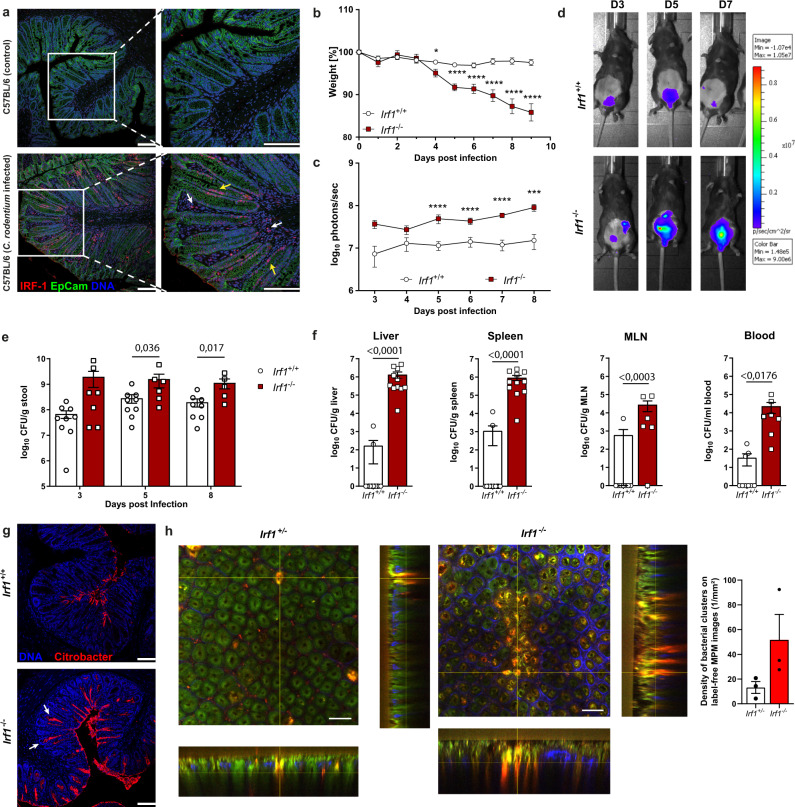
Fig. 1. IRF-1 expression is essential to mount efficient C. rodentium directed immunity.
a Colonic cross sections of uninfected or C. rodentium (9 dpi) infected C57BL/6 mice stained with anti-IRF-1 (red), anti-Ep-CAM (green), and DAPI (blue) and analyzed by confocal microscopy (epithelium: yellow arrow heads; lamina propria cells: white arrow heads). Scale bars represent 100 µm. b–g Irf1+/+ and Irf1–/– mice were infected orally with 4 × 10⁹ CFU of C. rodentium. b Weights of infected mice were recorded daily and plotted as percentage of baseline (Irf1+/+: n = 19, Irf1–/– n = 18). Day 4 pvalue: 0,0172; pvalues day5-day9: <0.0001. c, d Bacterial loads were measured via in vivo imaging (n = 15/group). Day 8 p value: 0.0008; p values day5–day7: <0.0001. e Fecal bacterial loads (CFU/g stool) on 3, 5 and 8 dpi. (Irf1+/+: n = 9, Irf1–/– n = 7). f Dissemination of C. rodentium to livers (Irf1+/+: n = 13, Irf1–/– n = 11), spleens (Irf1+/+: n = 13, Irf1–/– n = 11), mLN (Irf1+/+: n = 8, Irf1–/– n = 6) and blood (Irf1+/+: n = 8, Irf1–/– n = 6) (9 dpi). g C. rodentium colonization of the colonic epithelial surface and penetration of the crypt bottom (white arrow heads) was visualized by staining cross sections by immunohistochemistry. Scale bar: 100 µm. h Irf1+/+ and Irf1–/– mice (n = 3/group) were infected with a C. rodentium reporter-strain expressing M-Ruby-II. Tissue samples from distal colon (7 dpi) were analysed by label-free multiphoton microscopy (MPM; excitation at 810 nm) to define densities of bacterial clusters per MPM image (1/mm2). Scale bar: 50 µm. Data is expressed as mean ± SEM. Two-tailed Mann–Whitney U test was used for statistical comparison. In (e) and (f) exact p values are provided in the plots. *p ≤ 0.05; ***p ≤ 0.001; ****p ≤ 0.0001. Source data are provided as a Source data file.

