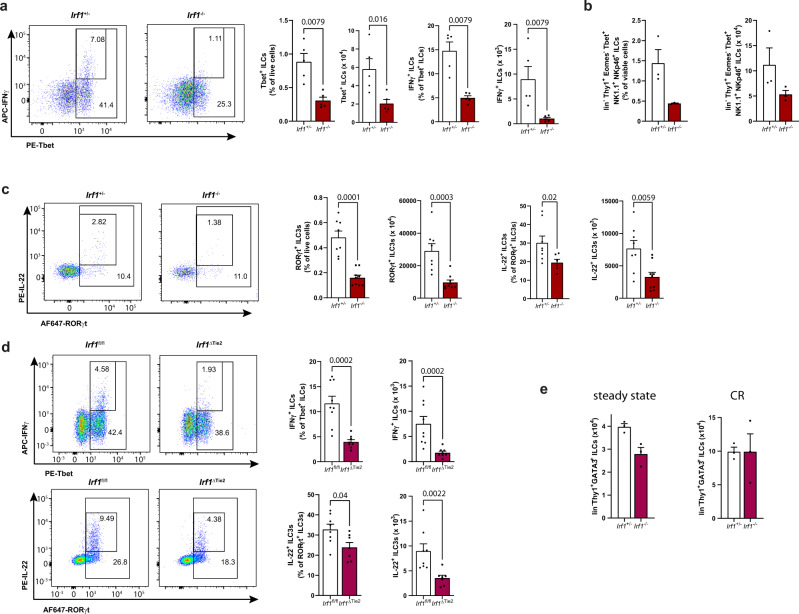
Fig. 5. Irf1 expression regulates cytokine responses of intestinal innate lymphoid cells.
a–d Irf1–/– and Irf1+/– control or Irf1ΔTie2 and Irf1fl/fl control mice were infected with C. rodentium. LPMCs were isolated at 8 dpi and analyzed by flow cytometry. Graphs show relative abundances and frequencies of Tbet+ ILCs (lin-Thy1.2+Tbet+), IFN-γ producing Tbet+ ILCs (lin-Thy1.2+Tbet+IFN-γ+), ILC1s (lin-Thy1.2+Tbet+EOMES-NK1.1+Nkp46+) as well as relative abundances and frequencies of RORγt+ ILC3s (lin-Thy1.2+RORγt+) and ILC3s expressing IL-22 (lin-Thy1.2+RORγt+IL-22+). a n = 5/group; (b) n = 3/group; (c) Irf1+/–: n = 8, Irf1+/–: n = 9. d Irf1fl/fl: n = 9, Irf1ΔTie2: n = 8. e Comparison of intestinal ILC2 frequencies in Irf1–/– and Irf1+/– control mice in the steady state or in the context of C. rodentium infection (CR); n = 3/group. Data is expressed as mean ± SEM. Exact p values defined by two-tailed Mann–Whitney U test are provided in the plots. Source data are provided as a Source data file.

