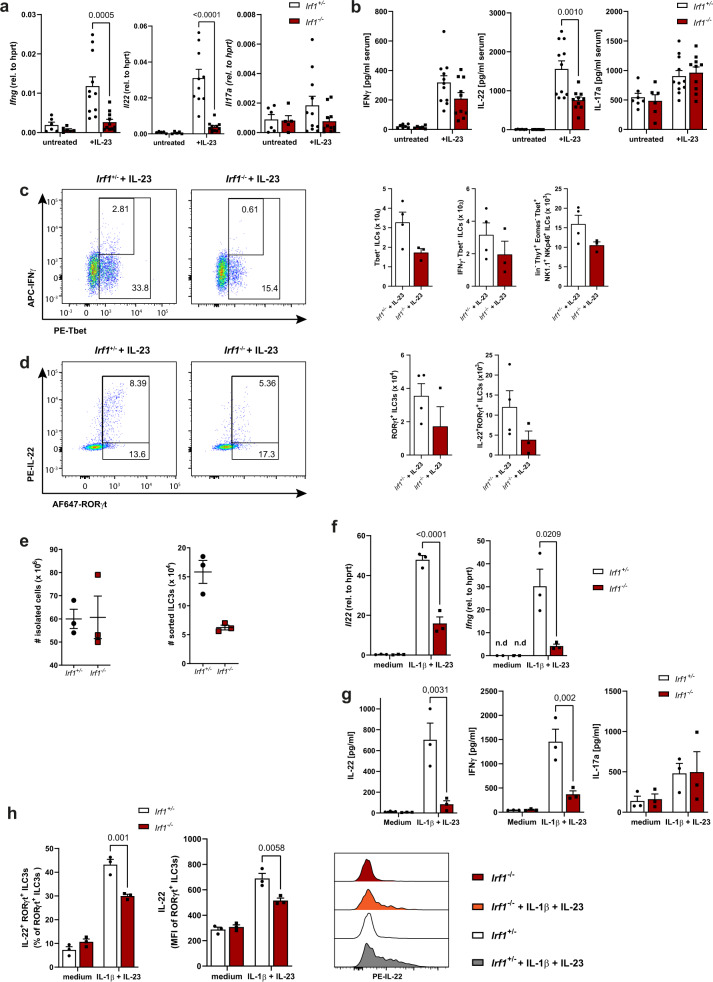
Fig. 6. Irf1-/- ILCs fail to produce IL-22 and IFN-γ due to a cell intrinsic defect.
a–d Irf1+/– and Irf1–/– mice were challenged with an IL-23-expression vector for three days. a The expression of Ifng, Il22 and Il17a in gut tissue samples was quantified by qRT-PCR with total RNA (Il17: Irf1+/– untreated n = 6, IL-23 n = 11; Irf1–/– untreated n = 5, IL-23 n = 11; Ifng: Irf1+/– untreated n = 6, IL-23 n = 11; Irf1–/– untreated n = 6, IL-23 n = 11; Il22: Irf1+/– untreated n = 5, IL-23 n = 10; Irf1–/– untreated n = 5, IL-23 n = 11) and (b) serum-concentrations of IFN-γ, IL-22 and IL-17a were measured by specific ELISAs (IL-17: Irf1+/– untreated n = 7, IL-23 n = 11; Irf1–/– untreated n = 6, IL-23 n = 10; IFN-γ: Irf1+/– untreated n = 7, IL-23 n = 11; Irf1–/– untreated n = 6, IL-23 n = 10; IL-22: Irf1+/– untreated n = 6, IL-23 n = 11; Irf1–/– untreated n = 6, IL-23 n = 10). c, d Intestinal LPMCs were isolated and analyzed by flow cytometry. Graphs show frequencies of Tbet+ ILCs (lin-Thy1.2+Tbet+ cells), ILC1s (lin-Thy1.2+Tbet+EOMES-NK1.1+Nkp46+), ROR-γt+ ILC3s (lin-Thy1.2+RORγt+ cells) and of ILC3s expressing IL-22 (Irf1+/–: n = 4, Irf1–/–: n = 3). e–h Irf1+/– and Irf1–/– ILCs were sort-purified from LPMC before in vitro stimulation (n = 3/group). e Numbers of input cells and the yield of sort-purified ILCs (CD45+B220-CD3-CD5-CD11b-CD11c-KLRG1-CD127+Thy1.2+ cells) are shown. f–h ILCs were stimulated with IL-1β (20 ng/ml) and IL-23 (20 ng/ml) or left unstimulated (medium). f Total RNA of ILCs was analyzed by specific qRT-PCR. g After 72 h, supernatants were collected to measure concentrations of IL-17A, IL-22 and IFN-γ by ELISA. h IL-22 production of RORγt+ILCs was studied by flow cytometry. Data is expressed as mean ± SEM. Exact p-values defined by 2way ANOVA with Tukey´s multiple comparisons test are provided in the plots. n.d.: not detectable. Source data are provided as a Source data file.

