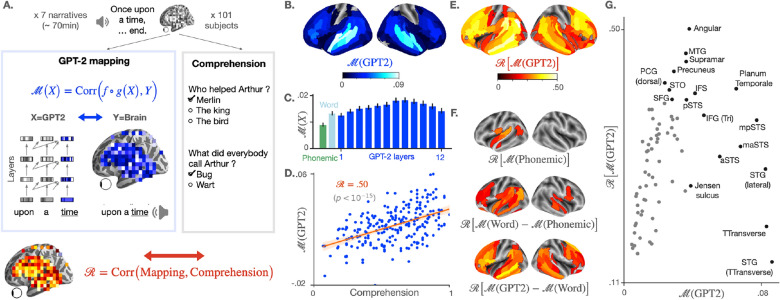
Figure 1.
Brain scores and their correlation with comprehension. (A) 101 subjects listen to narratives (70 min of unique audio stimulus in total) while their brain signal is recorded using functional MRI. At the end of each story, a questionnaire is submitted to each subject to assess their understanding, and the answers are summarized into a comprehension score specific to each (narrative, subject) pair (grey box). In parallel (blue box on the left), we measure the mapping between the subject’s brain activations and the activations of GPT-2, a deep network trained to predict a word given its past context, both elicited by the same narrative. To this end, a linear spatio-temporal model () is fitted to predict the brain activity of one voxel Y, given GPT-2 activations X as input. The degree of mapping, called “brain score” is defined for each voxel as the Pearson correlation between predicted and actual brain activity on held-out data (blue equation, cf. Methods). Finally, we test the correlation between the comprehension scores of the subjects and their corresponding brain scores using Pearson’s correlation (red equation). A positive correlation means that the representations shared across the brain and GPT-2 are key for the subjects to understand a narrative. (B) Brain scores (fMRI predictability) of the activations of the eighth layer of GPT-2. Scores are averaged across subjects, narratives, and voxels within brain regions (142 regions in each hemisphere, following a subdivision of Destrieux Atlas27, cf. Supplementary Information A). Only significant regions are displayed, as assessed with a two-sided Wilcoxon test across (subject, narrative) pairs, testing whether the brain score is significantly different from zero (threshold: 0.05). (C) Brain scores, averaged across fMRI voxels, for different activation spaces: phonological features (word rate, phoneme rate, phonemes, tone and stress, in green), the non-contextualized word embedding of GPT-2 (“Word”, light blue) and the activations of the contextualized layers of GPT-2 (from layer one to layer twelve, in blue). The error bars refer to the standard error of the mean across (subject, narrative) pairs (n = 237). (D) Comprehension and GPT-2 brain scores, averaged across voxels, for each (subject, narrative) pair. In red, Pearson’s correlation between the two (denoted ), the corresponding regression line and the 95% confidence interval of the regression coefficient. (E) Correlations () between comprehension and brain scores over regions of interest. Brain scores are first averaged across voxels within brain regions (similar to B), then correlated to the subjects’ comprehension scores. Only significant correlations are displayed (threshold: 0.05). (F) Correlation scores () between comprehension and the subjects’ brain mapping with phonological features (M(Phonemic) (i), the share of the word-embedding mapping that is not accounted by phonological features (ii) and the share of the GPT-2 eighth layer’s mapping not accounted by the word-embedding (iii). (G) Relationship between the average GPT-2-to-brain mapping (eighth layer) per region of interest (similar to B), and the corresponding correlation with comprehension (, similar to D). Only regions of the left hemisphere, significant in both (B) and (E) are displayed. In black, the top ten regions in terms of brain and correlation scores (cf. Supplementary Information A for the acronyms). Significance in (D), (E) and (F) is assessed with Pearson’s p-value provided by SciPy28. In (B), (E) and (F), p-values are corrected for multiple comparison using a False Discovery Rate (Benjamin/Hochberg) over the 2 142 regions of interest.

