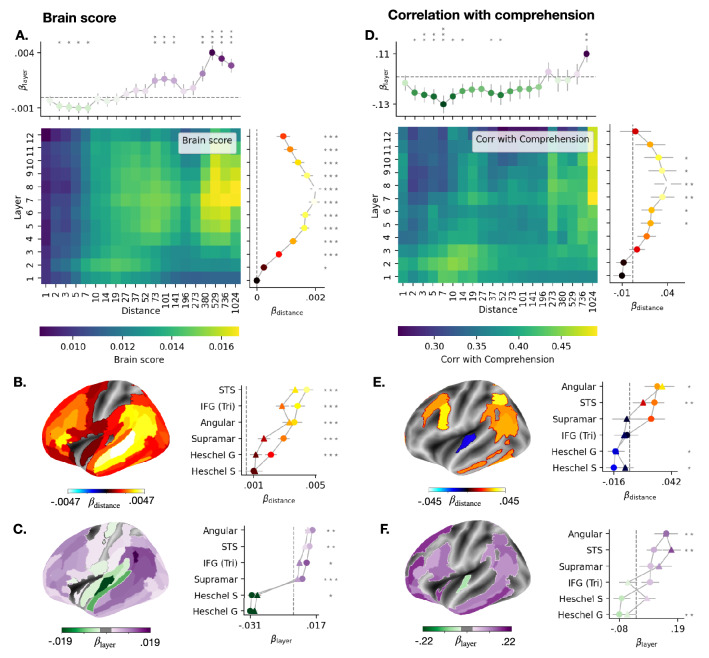
Figure 2.
Impact of GPT-2’s attention span on brain scores and comprehension scores. (A) The heatmap displays the average (across subjects, stories and voxels) brain scores as a function of attention span (“distance”) and layers. The top line displays the layer coefficients for each attention span (averaged across subjects, stories and voxels). The right line displays the distance coefficient for each layer (averaged across subjects, stories and voxels). The error bars correspond to the Standard Errors of the Mean (SEM) across subject-story pairs. (B) Distance coefficients for each brain region (averaged across subjects and stories). Statistical significance is assessed with a Wilcoxon test across subject-story pairs. (C) Layer coefficients for each brain region (averaged across subjects and stories). (D)–(F) Similar as (A)–(C), but the layer (and distance, respectively) coefficients now assess the relationship between layer (or distance, respectively) and comprehension scores. Statistical significance is assessed using a bootstrapping procedure with 1000 subsamples of subject-story pairs. Error bars are standard deviation across subsamples. For all brain maps, only significant values are displayed ( after FDR correction across brain regions).

