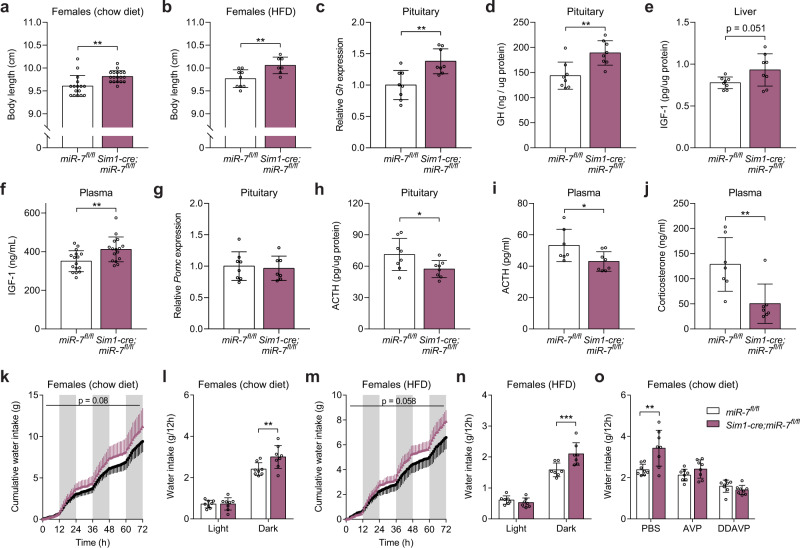
Fig. 3. Neuroendocrine abnormalities in mice lacking miR-7 in Sim1 neurons.
a–b Body length of chow-fed female (n = 16 and 18 animals) (a) and HFD-fed female (n = 9 and 7 animals) (b) mir-7fl/fl and Sim1-cre;mir-7fl/fl mice. c–j Pituitary Gh expression (relative to mir-7fl/fl) (n = 8 animals) (c), pituitary GH content (n = 8 animals) (d), liver IGF-1 content (n = 8 animals) (e), plasma IGF-1 concentration (n = 16 animals) (f), pituitary Pomc expression (relative to mir-7fl/fl) (n = 8 and 7 animals) (g), pituitary ACTH content (n = 8 animals) (h), plasma ACTH concentration (n = 8 and 7 animals) (i), and plasma corticosterone concentration (n = 7 animals) (j), in chow-fed mir-7fl/fl and Sim1-cre; mir-7fl/fl mice. k–n 72-hour metabolic cage measurements of chow-fed (n = 8 animals) (k–l) and HFD-fed (n = 7 animals) (m-n) female mir-7fl/fl and Sim1-cre;mir-7fl/fl mice. k, m cumulative water intake; (l, n) average water intake per 12-hour phase. Dark phases are shaded in grey. o Water intake of mir-7fl/fl and Sim1-cre;mir-7fl/fl mice during a 12-hour dark phase following intraperitoneal injection of PBS (phosphate-buffered saline), AVP ((Arg8)-Vasopressin), or DDAVP (Desmopressin) (n = 8 animals). Data are presented as mean ± SD. *P < 0.05; **P < 0.01; ***P < 0.001; no asterisk indicates P > 0.05; two-tailed t test (a–j), 2-way repeated measures ANOVA (k, m), or 2-way repeated measures ANOVA with Sidak’s multiple comparisons test (l, n, o). Source data are provided as a Source Data file.

