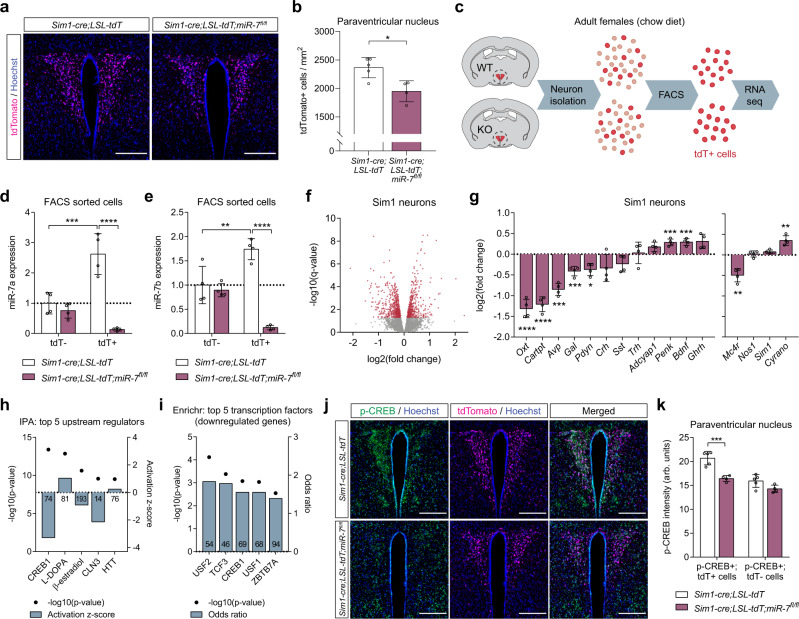
Fig. 4. Cellular dysfunction of Sim1 neurons upon mir-7 ablation.
a–b Representative image (scale bar: 250 μm) (a) and quantification (n = 5 and 4 animals) (b) of tdTomato-positive cells within the PVN of Sim1-cre;LSL-tdTomato and Sim1-cre;LSL-tdTomato;mir-7fl/fl mice. Magenta, tdTomato; blue, Hoechst. c Schematic of sample preparation for RNA sequencing of Sim1 neurons from Sim1-cre;LSL-tdTomato (“WT”) and Sim1-cre;LSL-tdTomato;mir-7fl/fl (“KO”) mice. d–e miR-7a (d) and miR-7b (e) expression in tdTomato-negative and tdTomato-positive FACS-sorted cells from hypothalamus of Sim1-cre;LSL-tdTomato and Sim1-cre;LSL-tdTomato;mir-7fl/fl mice (n = 4 samples, with 4 mice pooled per sample). Expression is relative to tdT-negative cells from Sim1-cre;LSL-tdTomato mice. f –log10(q-value) and log2(fold change) of all expressed genes in Sim1-cre;LSL-tdTomato;mir-7fl/fl versus Sim1-cre;LSL-tdTomato RNA sequencing data. Significantly regulated genes (q < 0.05) are indicated in red. g log2(fold change) of key neuropeptide-encoding genes (left panel), and Mc4r, Nos1, Sim1, and Cyrano (right panel) in Sim1-cre;LSL-tdTomato;mir-7fl/fl versus Sim1-cre;LSL-tdTomato RNA sequencing data (n = 4 samples, with 4 mice pooled per sample). h –log10(p-value) and activation z-scores of top upstream regulators identified by QIAGEN Ingenuity Pathway Analysis of Sim1-cre;LSL-tdTomato;mir-7fl/fl versus Sim1-cre;LSL-tdTomato RNA sequencing data. Numbers in the bars indicate the number of genes contributing to the prediction. i –log10(p-value) and odds ratio of top transcription factors identified by Enrichr “ENCODE and ChEA Consensus Transcription Factors from ChIP-X” of downregulated genes in Sim1-cre;LSL-tdTomato;mir-7fl/fl versus Sim1-cre;LSL-tdTomato RNA sequencing data. Numbers in the bars indicate the number of genes contributing to the prediction. j–k Representative immunofluorescence (scale bar: 250 μm) (j) and quantification (n = 5 and 4 animals) (k) of p-CREB intensity in p-CREB+ /tdTomato+ cells and p-CREB+ /tdTomato– cells in the PVN of Sim1-cre;LSL-tdTomato and Sim1-cre;LSL-tdTomato;mir-7fl/fl mice. Green, p-CREB; magenta, tdTomato; blue, Hoechst. Data are presented as mean ± SD, where error bars are present. *P < 0.05; **P < 0.01; ***P < 0.001; ****P < 0.0001; no asterisk indicates P > 0.05; two-tailed t test (b), 2-way ANOVA with Sidak’s multiple comparisons test (d, e, k), or Fisher’s exact test (h, i). *q < 0.05; **q < 0.01; ***q < 0.001; ****q < 0.0001; quasi-likelihood (QL) differential expression test (f, g). Source data are provided as a Source Data file.

