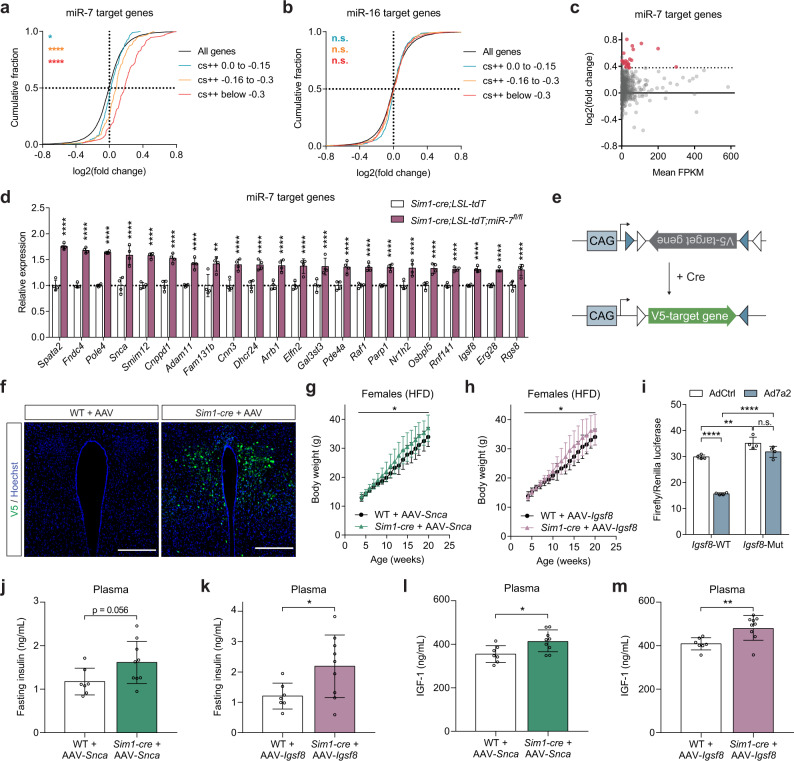
Fig. 5. Identification of miR-7 target genes involved in Sim1 neuron function.
a–b Cumulative frequency distribution of mRNA changes for predicted targets of miR-7 (a) or miR-16 (b) in Sim1-cre;LSL-tdTomato;mir-7fl/fl versus Sim1-cre;LSL-tdTomato RNA sequencing data. Targets are binned by cumulative weighted context ++ score (cs + +) and compared to all expressed genes. Number of genes per bin for miR-7: black, 16830; blue, 225; orange, 149; red, 112. Number of genes per bin for miR-16: black, 16830; blue, 332; orange, 408; red, 425. c log2(fold change) and mean FPKM (fragments per kilobase of transcript per million fragments mapped) of all predicted conserved miR-7 target genes in Sim1-cre;LSL-tdTomato;mir-7fl/fl versus Sim1-cre;LSL-tdTomato RNA sequencing data. Targets with >1.3-fold upregulation are shown in red. d Expression (relative to Sim1-cre;LSL-tdTomato) of upregulated targets in Sim1-cre;LSL-tdTomato;mir-7fl/fl versus Sim1-cre;LSL-tdTomato RNA sequencing data (n = 4 samples, with 4 mice pooled per sample). e Strategy of Cre-dependent target overexpression using a pAAV-FLEx vector. f V5 immunofluorescence in the PVN of WT (representative of 3 mice) and Sim1-cre mice (representative of 3 mice), 4 months after injection with AAV-Snca (scale bar: 250 μm). Green, V5; Blue, Hoechst. g–h Body weight of HFD-fed female WT and Sim1-cre mice injected with AAV-Snca (n = 7 and 9 animals) (g) or AAV-Igsf8 (n = 7 and 9 animals) (h). i Luciferase assay of cells expressing the WT or mutated 3’UTR of Igsf8, with or without miR-7 overexpression (n = 4; representative of two independent experiments). j–m Plasma insulin (j–k) and IGF-1 (l–m) in WT and Sim1-cre mice injected with AAV-Snca (n = 7 and 9 animals) (j, l) or AAV-Igsf8 (n = 7 and 9 animals) (k, m). Data are presented as mean ± SD, where error bars are present. *P < 0.05; **P < 0.01; ***P < 0.001; ****P < 0.0001; no asterisk or n.s. indicates P > 0.05; Kruskal-Wallis test with Dunn’s multiple comparisons test (a, b), 2-way repeated measures ANOVA (g, h; genotype-by-time interaction), 2-way ANOVA with Sidak’s multiple comparisons test (i), or two-tailed t test (j–m). **q < 0.01; ****q < 0.0001; quasi-likelihood (QL) differential expression test (c, d). Source data are provided as a Source Data file.

