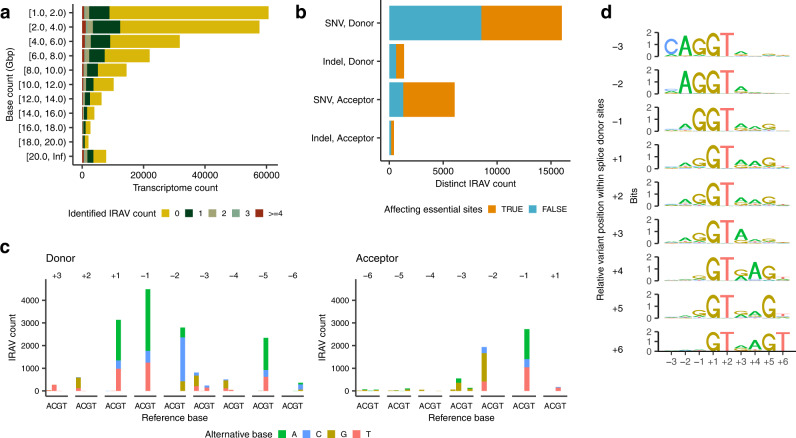
Fig. 3. Overviews of IRAVs identified from Sequencing Read Archive.
a Frequencies of transcriptome sequencing data analyzed binned by the amount of base counts. Transcriptome data were also grouped by the number of detected IRAVs. For example, in the rows [1.0, 2.0), zero, one, two, three, and four or more IRAVs were identified in 51,793, 6,600, 1,187, 419, and 659 transcriptome sequence data, respectively, whose base count are ≥1.0 Gbp and <2.0 Gbp. b The number of distinct IRAVs affecting or not affecting essential splice-site (GT-AG), stratified by (1) donor or acceptor and (2) SNVs or indels. c Base substitution patterns of IRAVs at each exonic and intronic position of splice donor and acceptor sites. Different colors are used to display different types of alternative bases. The x-axes represent different reference bases, and the y-axes represent the numbers of variants. d Sequence motifs of splicing donor sites for IRAVs classified by relative variant position to exon-intron boundaries.

