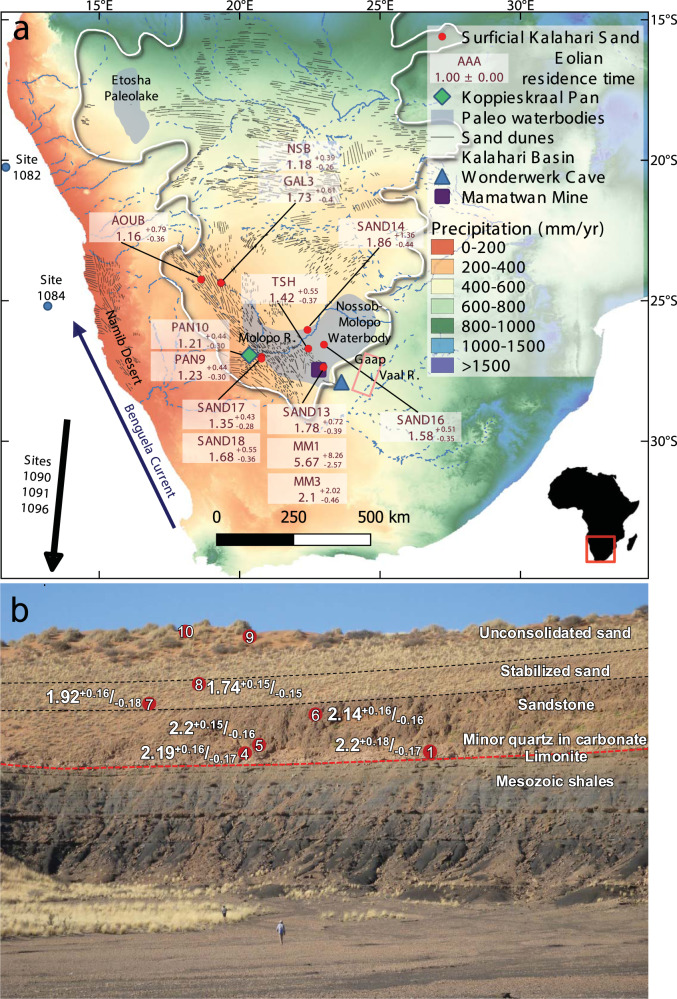
Fig. 1. Eolian chronology of the Kalahari Desert Sand.
a Locations of sand samples and sites mentioned in the text are superimposed on the modern precipitation map of southern Africa (map made with QGIS. Climate data is from Fick, S.E. and R.J. Hijmans. WorldClim 2: new 1 km spatial resolution climate surfaces for global land areas. International Journal of Climatology 37 (12): 4302–4315, 2017). Eolian residence time is the weighted average of the simulated duration in which agreement between simulated and measured radionuclides was achieved and is marked with a black line in Fig. 2. Inset: the red rectangle depicts the area of the main figure within the African continent (image from Vecteezy.com). b A 60 m thick exposure at the northeastern wall of Koppieskraal Pan (see location in Fig. 1a) where ~40 m of consolidated Kalahari Sand overlies Mesozoic shales of the Karoo supergroup. Burial ages (reported in Ma with 1σ uncertainty) were calculated assuming pre-burial 26Al/10Be between 5.56 and 5.79 (estimated iteratively after28). Numbers in red circles correspond to the sample’s serial number in the supplementary data.

