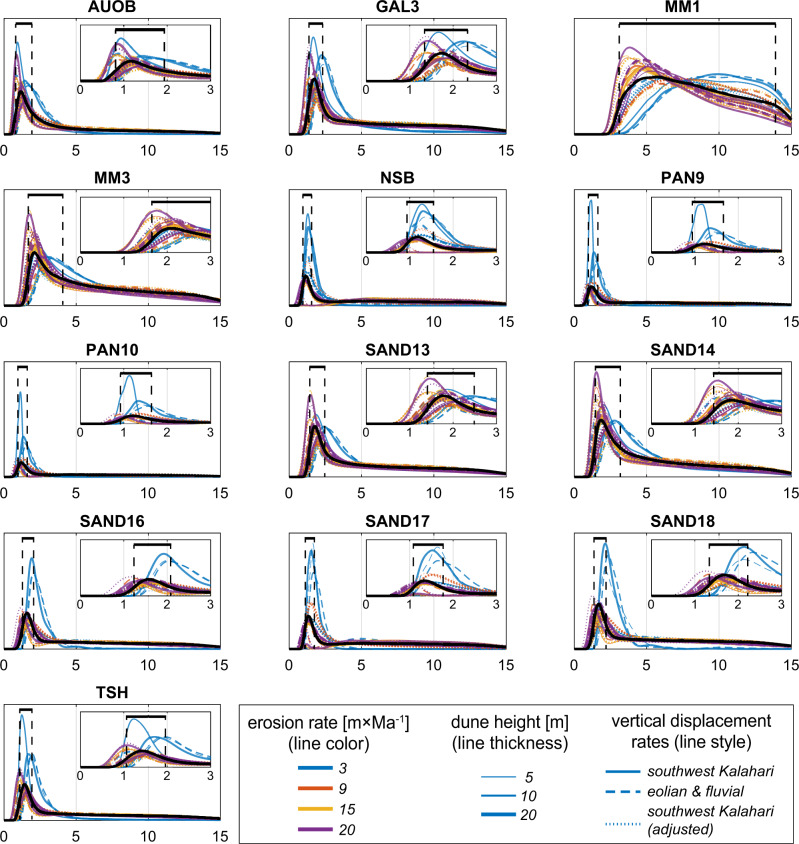
Fig. 2. Kernel density estimates of simulations performed to assess eolian residence time of Kalahari Sand.
Simulations were carried out using the Cosmolian program27 in which modeled concentrations of 26Al 10Be simulated measured values in Kalahari Sand samples. Results are the outcome of 10,000 simulations for each of the 36 combinations of parameters representing possible scenarios considered for each sample. These boundary conditions include four paleo-erosion rates, three dune heights, and three datasets of vertical displacement rates constructed from luminescence and 14C ages of the Kalahari Sand. In twelve out of thirteen samples, kernel density estimates are clustered into distinct peaks that range within a narrow time span. For each sample, the weighted average of all simulations is shown with a black solid line, and its highest probability is interpreted as the eolian residence time. The uncertainty of the black line was calculated with full-width at half-maximum approach, and is marked with dashed black lines. The name of each sample corresponds to the names in Fig. 1a.

