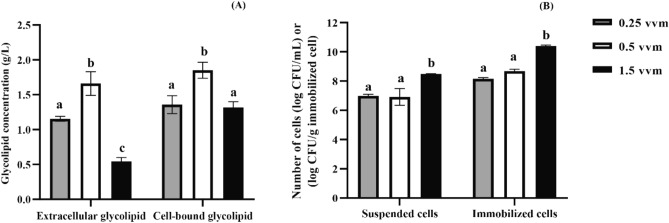
Figure 3.
Crude glycolipid concentrations (A) and bacterial cell numbers (B) in a stirred tank fermenter with different aeration rates. The glycolipid concentration was based on the volume of productive medium. Error bars represent the standard deviation of the mean (n = 3). Two-way ANOVA: Tukey’s multiple comparison test was used for statistical analysis. Different letters represent statistically significant differences (p < 0.05).

