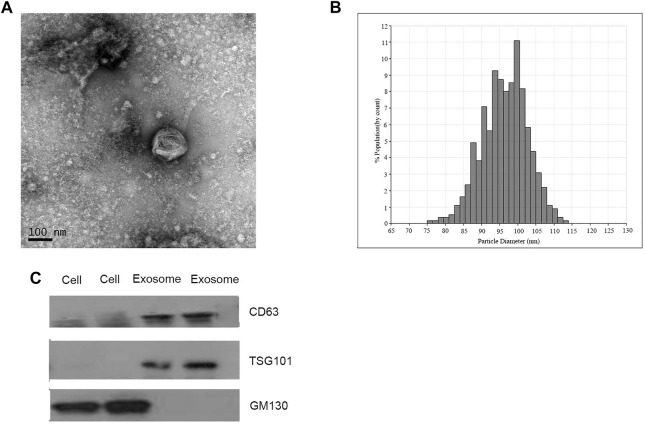
FIGURE 1.
Identification of isolated exosomes. (A) TEM image of exosomes from CRC patients with 50–150 nm diameter (scale bar: 100 nm; high voltage (HV) = 100 kV). (B) Size distribution of exosomes with 50–150 nm diameter were measured by qNano system. (C) Western blot analysis of CD63, TSG101, and GM130 as exosomal markers.

