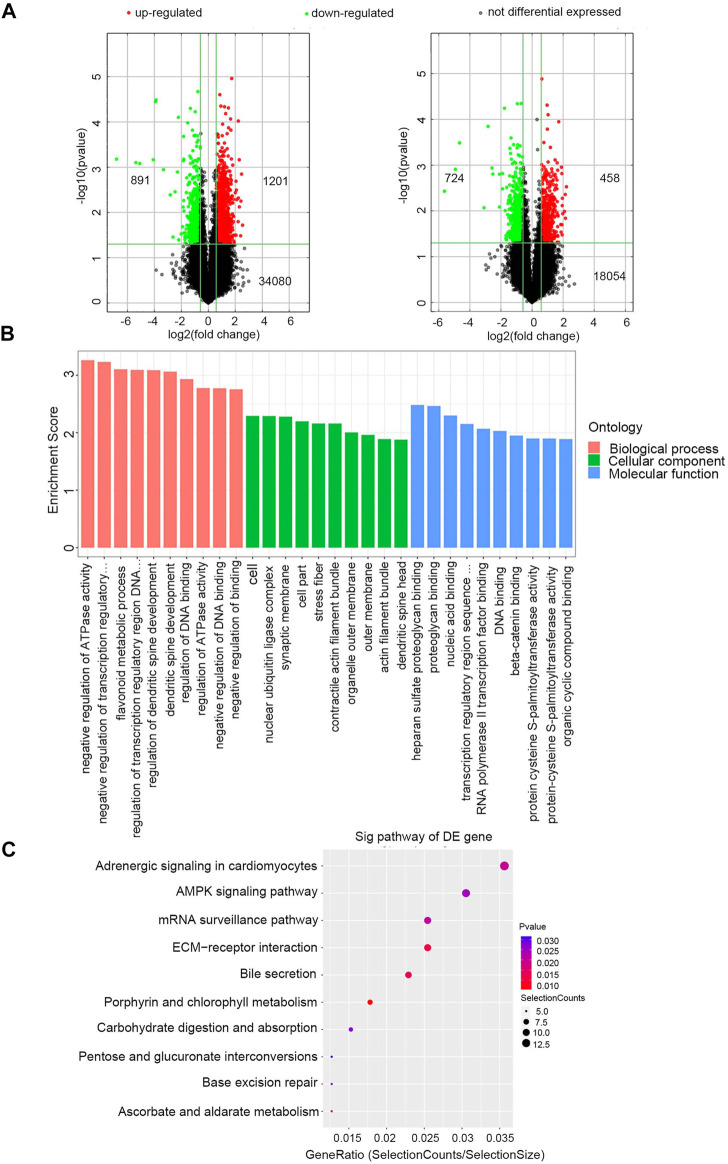
FIGURE 2.
Identification of exosomal DERNAs and Gene ontology and pathway analysis of DEmRNAs (A) Exosomal lncRNA and mRNA were compared by the volcano graph the expression fold changes in healthy donors and CRC patients. The green dots indicated the downregulated lncRNAs and mRNAs, the red dots indicated the upregulated lncRNAs and mRNAs and the black dots represent no differential expressed. (B) DE mRNAs were clustered in top 10 terms from a GO analysis of molecular function, biological process and cellular component. (C) DE mRNAs were clustered in Kyoto Encyclopedia ofGenes and Genomes (KEGG) pathways.

