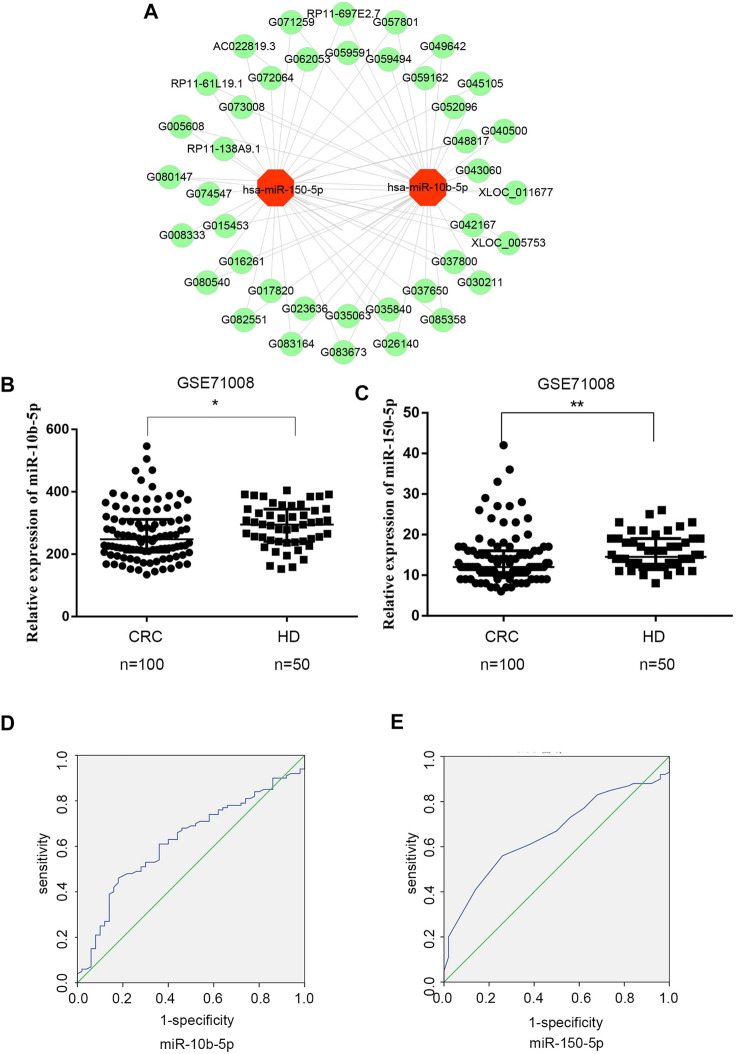
FIGURE 3.
Expression analysis of exosomal DElncRNA-DEmiRNAs pairs in CRC (A) Exosomal DElncRNA-DEmiRNAs pairs, the green dots represents up-regulated DElncRNAs, the red dots represents DEmiRNAs (B) Mann‐Whitney U test shows that there is a significant differences in miR-10b-5p expression levels between CRC patients and healthy donors in GSE71008 dataset. Data were expressed as median with interquartile range (*p = 0.0125). (C) Mann‐Whitney U test showed that there is a significant difference in miR-150-5p expression levels between CRC patients vs. healthy donors in GSE71008 dataset. Data were expressed as median with interquartile range (p = **0.0014). (D,E) The AUC of exosomal miR-10b-5p and exosomal miR-105-5p was 0.625 and 0.658 in 100 CRC patients vs. 50 healthy donors.

