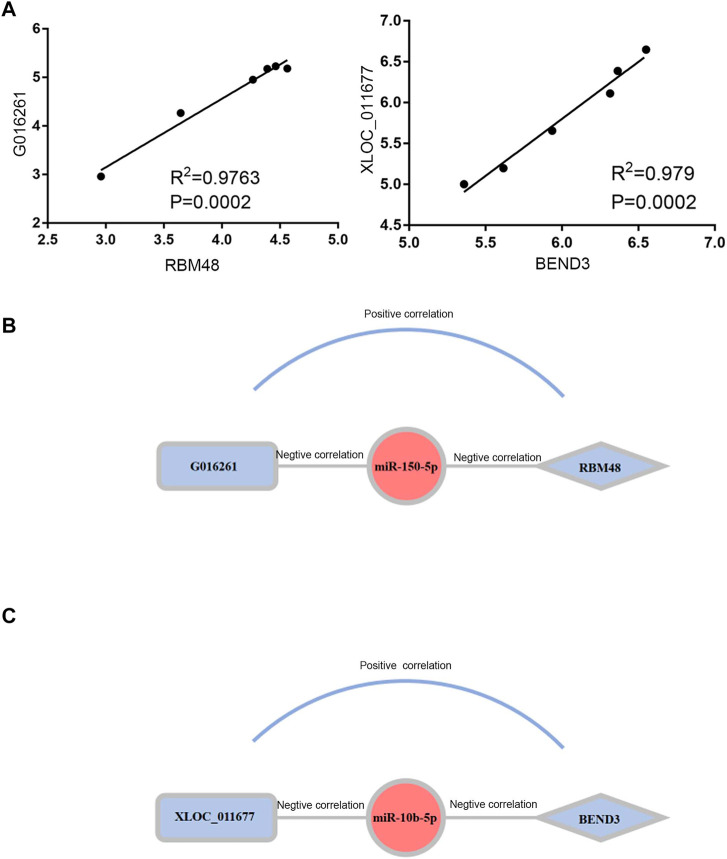
FIGURE 5.
Construction and Correlation analyses of exosomal ceRNA network in CRC. (A) Pearson correlation analysis for exosomal DElncRNAs and associated DEmRNAs. Horizontal axis indicates normalized exosomal DElncRNA expression levels; vertical axis indicates normalized exosomal DEmRNA expression levels (lncRNA xloc_011677 correlates to BEND3, lncRNA G016261 correlates to RBM48).(B,C)The exosomal lncRNA G016261-miR-150-5p-RBM48 and exosomal lncRNA XLOC_01167-miR-10b-5p-BEND3 regulatory axis, miRNAs, lncRNAs and mRNAs are represented by ellipse, round rectangle and diamonds, respectively.

