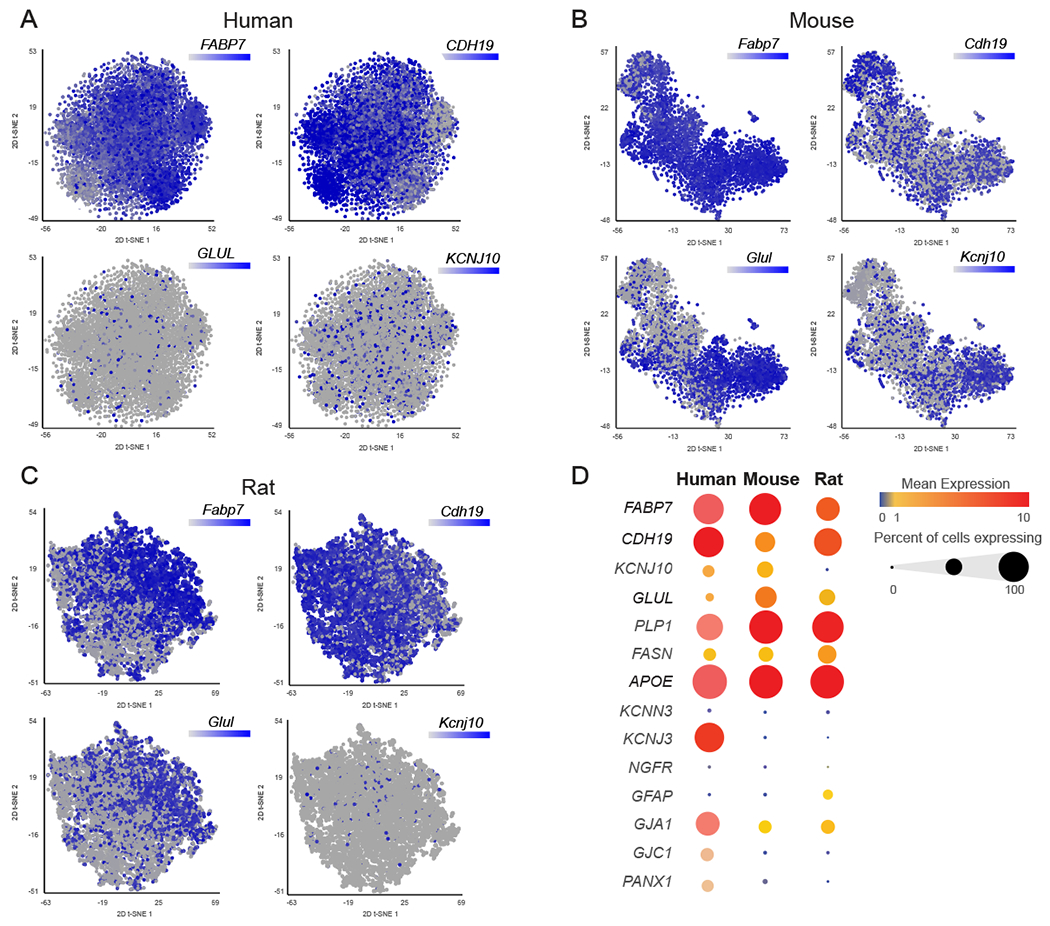
Figure 3: SGC marker genes in mouse, rat and human.

(A) t-SNE overlay of pooled SGC for expression of SGC marker genes FABP7, CADH19, GLUL and KCNJ10 in human (7,880 cells)
(B) t-SNE overlay for expression of SGC marker genes Fabp7, Cadh19, Glul and Kcnj10 in mouse (3,460 cells)
(C) t-SNE overlay for expression of SGC marker genes Fabp7, Cadh19, Glul and Kcnj10 in rat (8,428 cells)
(D) Bubble plot showing the normalized count expression of the indicated SGC marker genes in each species. Dot size represents the percentage of cells that express the corresponding genes and the color represents the mean expression level.
