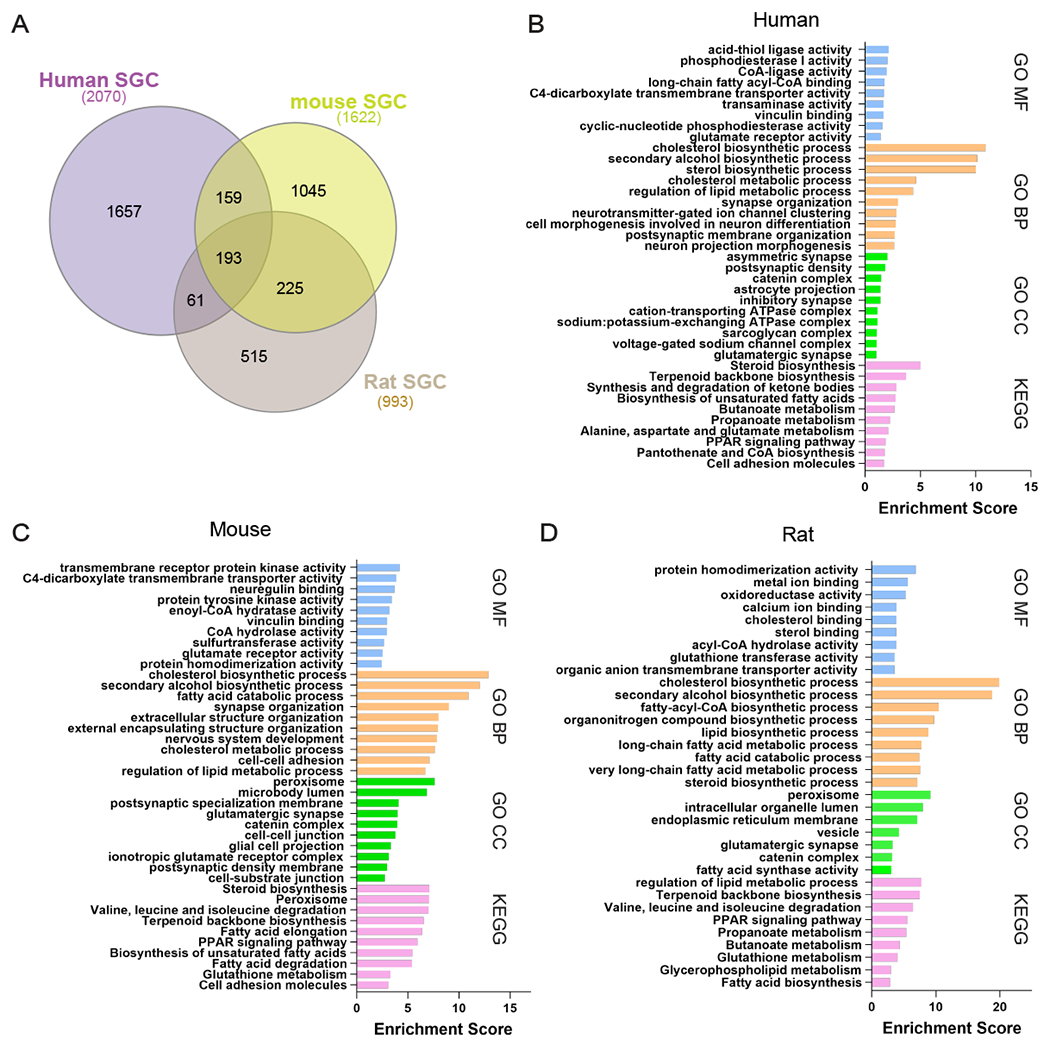
Figure 5: Enrichment of genes and pathways in human, mouse and rat SGC.

(A) Venn diagram for enriched genes in SGC compared to other cells in the DRG from mouse (1,622 genes), rat (993 genes) and human (2,070 genes).
(B) Pathway analysis (KEGG/GO) of enriched genes express in human SGC.
(C) Pathway analysis (KEGG/GO) of enriched genes express in mouse SGC.
(D) Pathway analysis (KEGG/GO) of enriched genes express in rat SGC.
