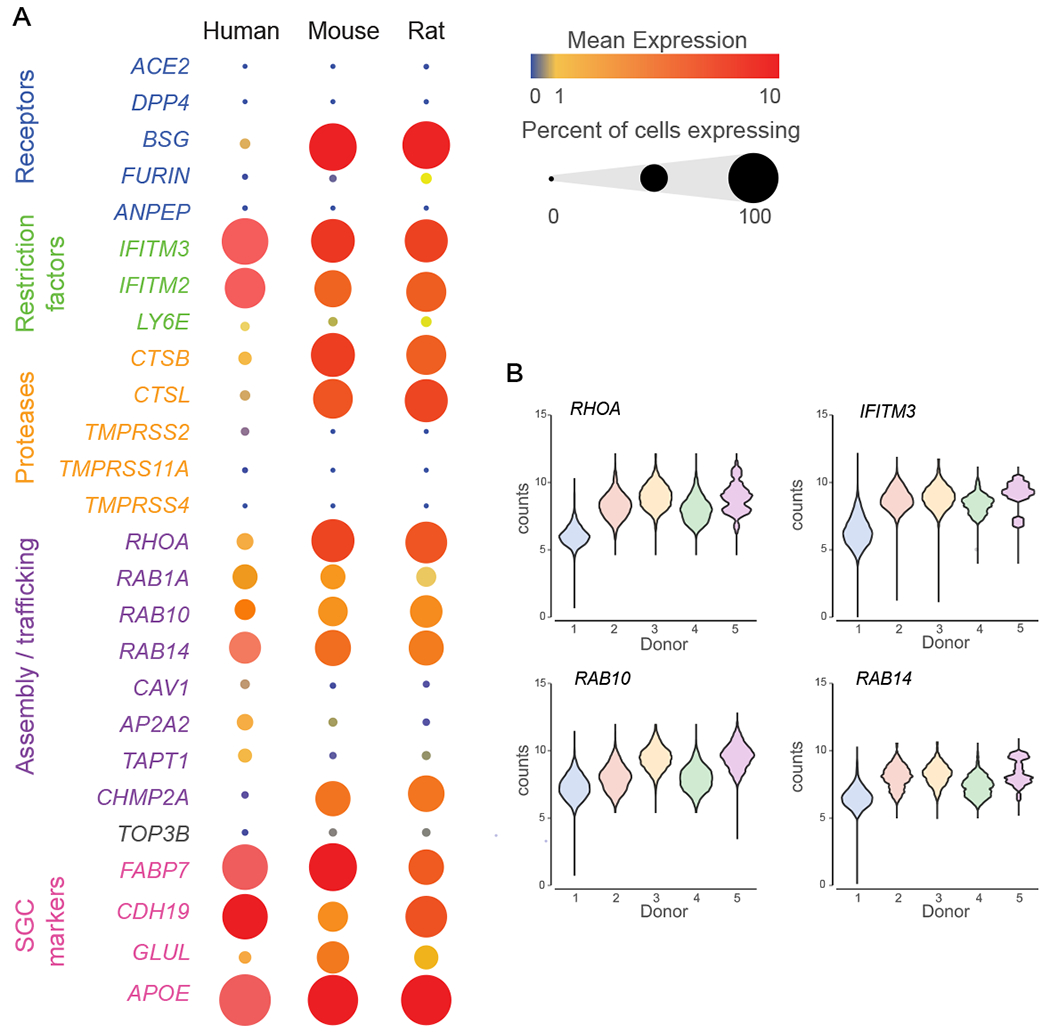
Figure 7: Enrichment of SCARF genes in human, mouse and rat SGC.

(A) Bubble plot showing the normalized counts expression of SCARF genes in each SGC species. Dot size represent the percentage of cells expressing the corresponding gene and the color represents the mean expression level.
(B) Violin plots of top normalized counts expression of SCARF genes in human SGC across individual donors.
