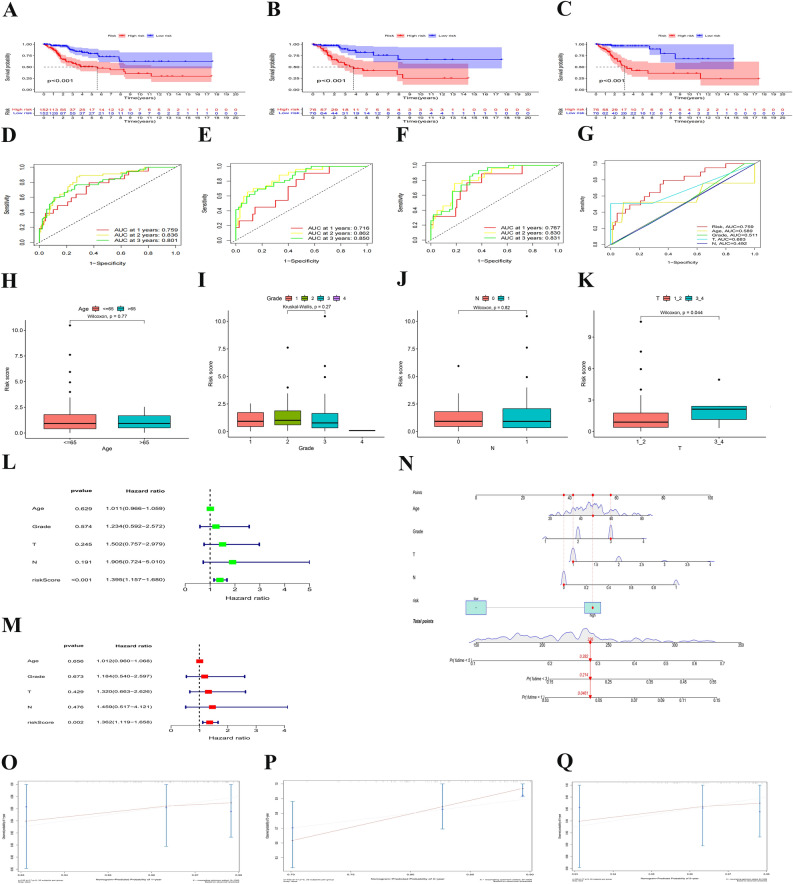
Figure 3.
Associations between risk signature and clinicopathological factors. (A–C) Survival curve of CESC patients. (D–F) TimeROC curves with two sets of validation datasetsand and (G) Clinical ROC curves to forecast overall survival of patients. Visualization of risk scores in clinical data (H–K). Univariate (L) and multivariate Cox (M) regression of clinicopathological features in TCGE-CESC cohort. (N) Nomogram constructed to predit OS rates at 1, 3 and 5 years. (P–Q) The nomagram calibration curves were applied for investigation the deviation in nomagram-predicated and actual 1-, 3-, and 5-years survival probabilities.

