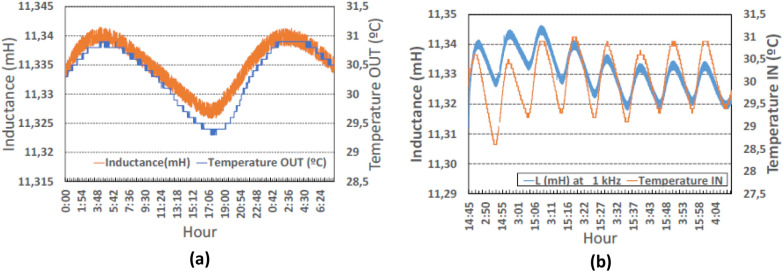
Figure. 2.
Inductance measurements vs temperature. (a) Plot of the inductance outside the box (from 2020 November 3 to 11) along with temperature beside the coil. The inductance follows the temperature variations. Time span of about two days for better visualize the synchronism of inductance and temperature (b) plot of the inductance inside the box (from 27 Oct to Nov 3); as expected, inductance deviates from temperature variations.

