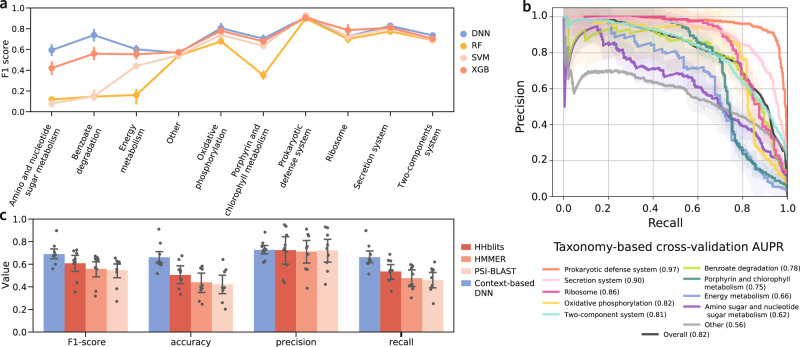
Fig. 3. Embedding-based function prediction performance assessment and benchmarking.
a Classifier comparison. F1 scores were obtained for each category using the leave-one-taxonomic-group-out cross-validation. Each dot represents the average with error bars of ±1 SD obtained from the n = 5 folds. DNN deep neural network, RF random forest, SVM support vector machine, XGB XGBoost. b Precision–recall curves per functional category calculated using leave-one-taxonomic-group-out cross-validation (see also Supplementary Fig. 2). The “Overall” group refers to the micro-average of all categories combined (i.e., aggregating the predictions of all categories to compute the average). The numeric values of the areas under the curves are denoted for each functional category in the figure legend in parenthesis. Each category line presents the micro-average of the cross-validation folds with ±1 SD. c Comparison of our approach against remote-homology search approaches, based on leave-one-KO-out cross-validation. Evaluation metrics were obtained for each of the nine functional categories that are indicated by gray dots. Bar height is the average score with error bars of ±1 SD. Source data are provided as a Source Data file.

