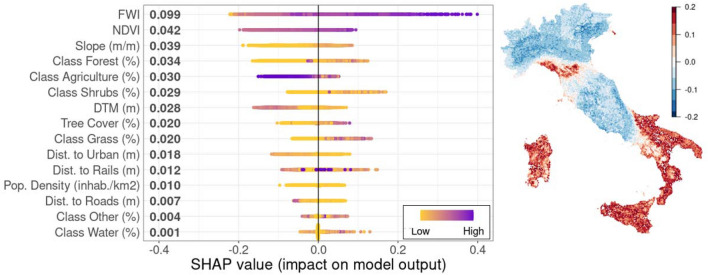
Figure 5.
(Left panel) Shapley values for wildfire occurrence prediction. On the y-axis, the features are sorted by decreasing importance while the x-axis shows the SHAP value distribution and denotes whether a variable contributes to reduce or to increase the fire probability. Gradient colors indicate the original value for that variable. Each point represents a row from the original dataset. (Right panel) Fire Weather Index (FWI) Shapley values. For sake of readability, SHAP values exceeding the [− 0.2, 0.2] range were assigned the same colors of extreme points of the chosen interval. The map was produced by using the plot.raster function from "raster" R package.

