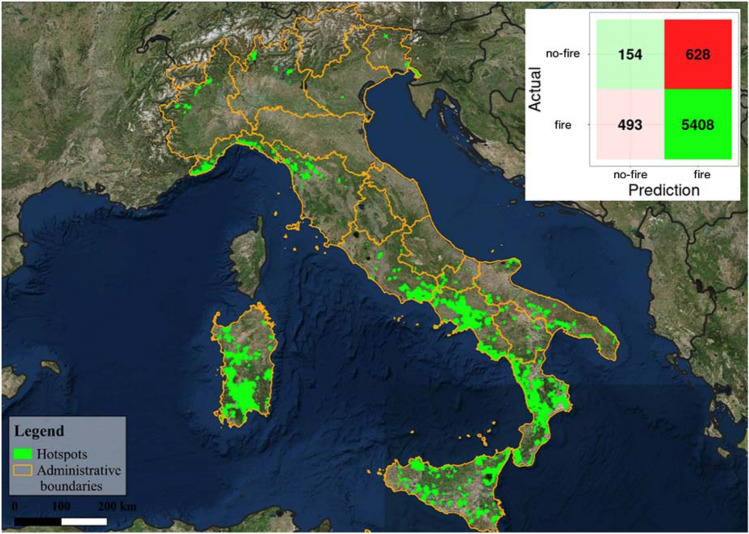
Figure 7.
Spatial distribution of wildfire hotspots according to Getis-Ord G* statistics at a 95% confidence interval. Confusion matrix between RF predictions and actual binary labels (top right grid). The green scale for diagonal terms and red scale for off-diagonal terms in the confusion matrix emphasize the impact of the matrix terms on the overall ratio. The map was produced on QGIS using the "new layout" feature. The map was produced by using the plot.raster function from "raster" R package.

