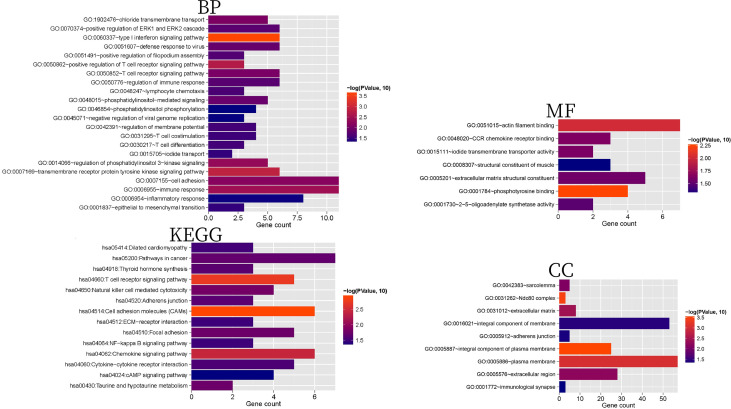
Figure 3.
BP, CC, MF, and KEGG histograms related to 171 mRNAs with significant differential expression. The horizontal axis represents the number of genes, the vertical axis represents the significantly related items, and the color represents the correlation. The closer to red, the higher the significance.

