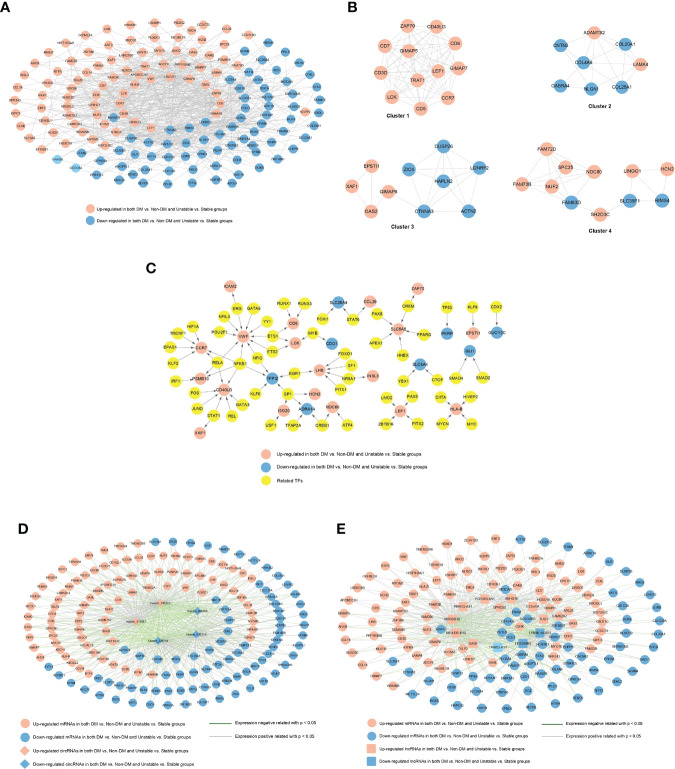
Figure 4.
(A) PPI network of significantly differentially expressed genes. The red and blue nodes represent the genes that are significantly upregulated and downregulated, respectively, in the two comparison groups. (B) Interaction network module diagram. The red and blue nodes represent the genes that are significantly upregulated and downregulated, respectively, in the two comparison groups. (C) TF-differential gene regulatory network. The yellow square and circle represent TFs and significantly differentially expressed genes, respectively, and the red and blue nodes represent the genes that are significantly upregulated and downregulated, respectively, in the two comparison groups. (D) circRNAs-miRNA co-expression network, red and blue represent the RNAs that are significantly upregulated and downregulated, respectively, in the two comparison groups, and round and diamond represent mRNAs and circRNAs, respectively; The blue and gray lines indicate significant negative and positive correlations, respectively. (E) lncRNA-miRNA co-expression network, red and blue represent the RNAs that are significantly upregulated and downregulated, respectively, in the two comparison groups, and round and square respectively represent mRNAs and lncRNAs; The blue and gray lines indicate significant negative and positive correlations, respectively.

